
Fig. 6.
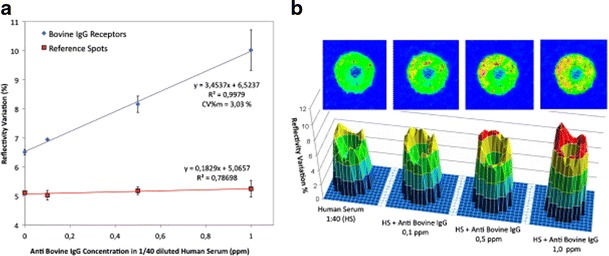
(a) Anti-bovine IgG calibration in 1/40-diluted human serum. (b) Difference images of one bovine IgG spot of the array after the binding event with anti-bIgG at different concentrations and, lower, 3D elaboration of the same binding data obtained by “Data Analyzer.” Reprinted with permission from Elsevier [86]