Fig. 1.

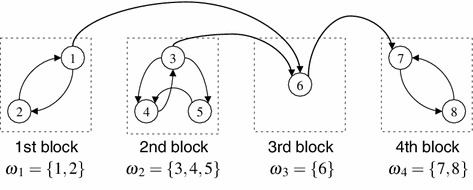
Diagram for transmission of the disease when the transportation network is not strongly connected. In this example, there are eight regions categorised by four blocks. The arrows indicate the transport connections

Diagram for transmission of the disease when the transportation network is not strongly connected. In this example, there are eight regions categorised by four blocks. The arrows indicate the transport connections