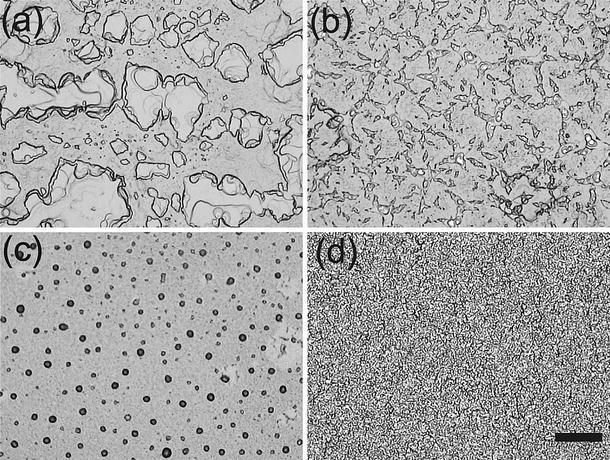
Fig. 1.

Protein/lipid films imaged in the fluid state (i.e., T = 45°C, RH = 98%) by bright field contrast for a the pure DMPC, b M2, c Vpu and d SARS-CoV E protein at a concentration of P/L = 1/10. The structure of the lipid film changes with the protein type. The scale bar corresponds to 100 μm
