
Figure 4.
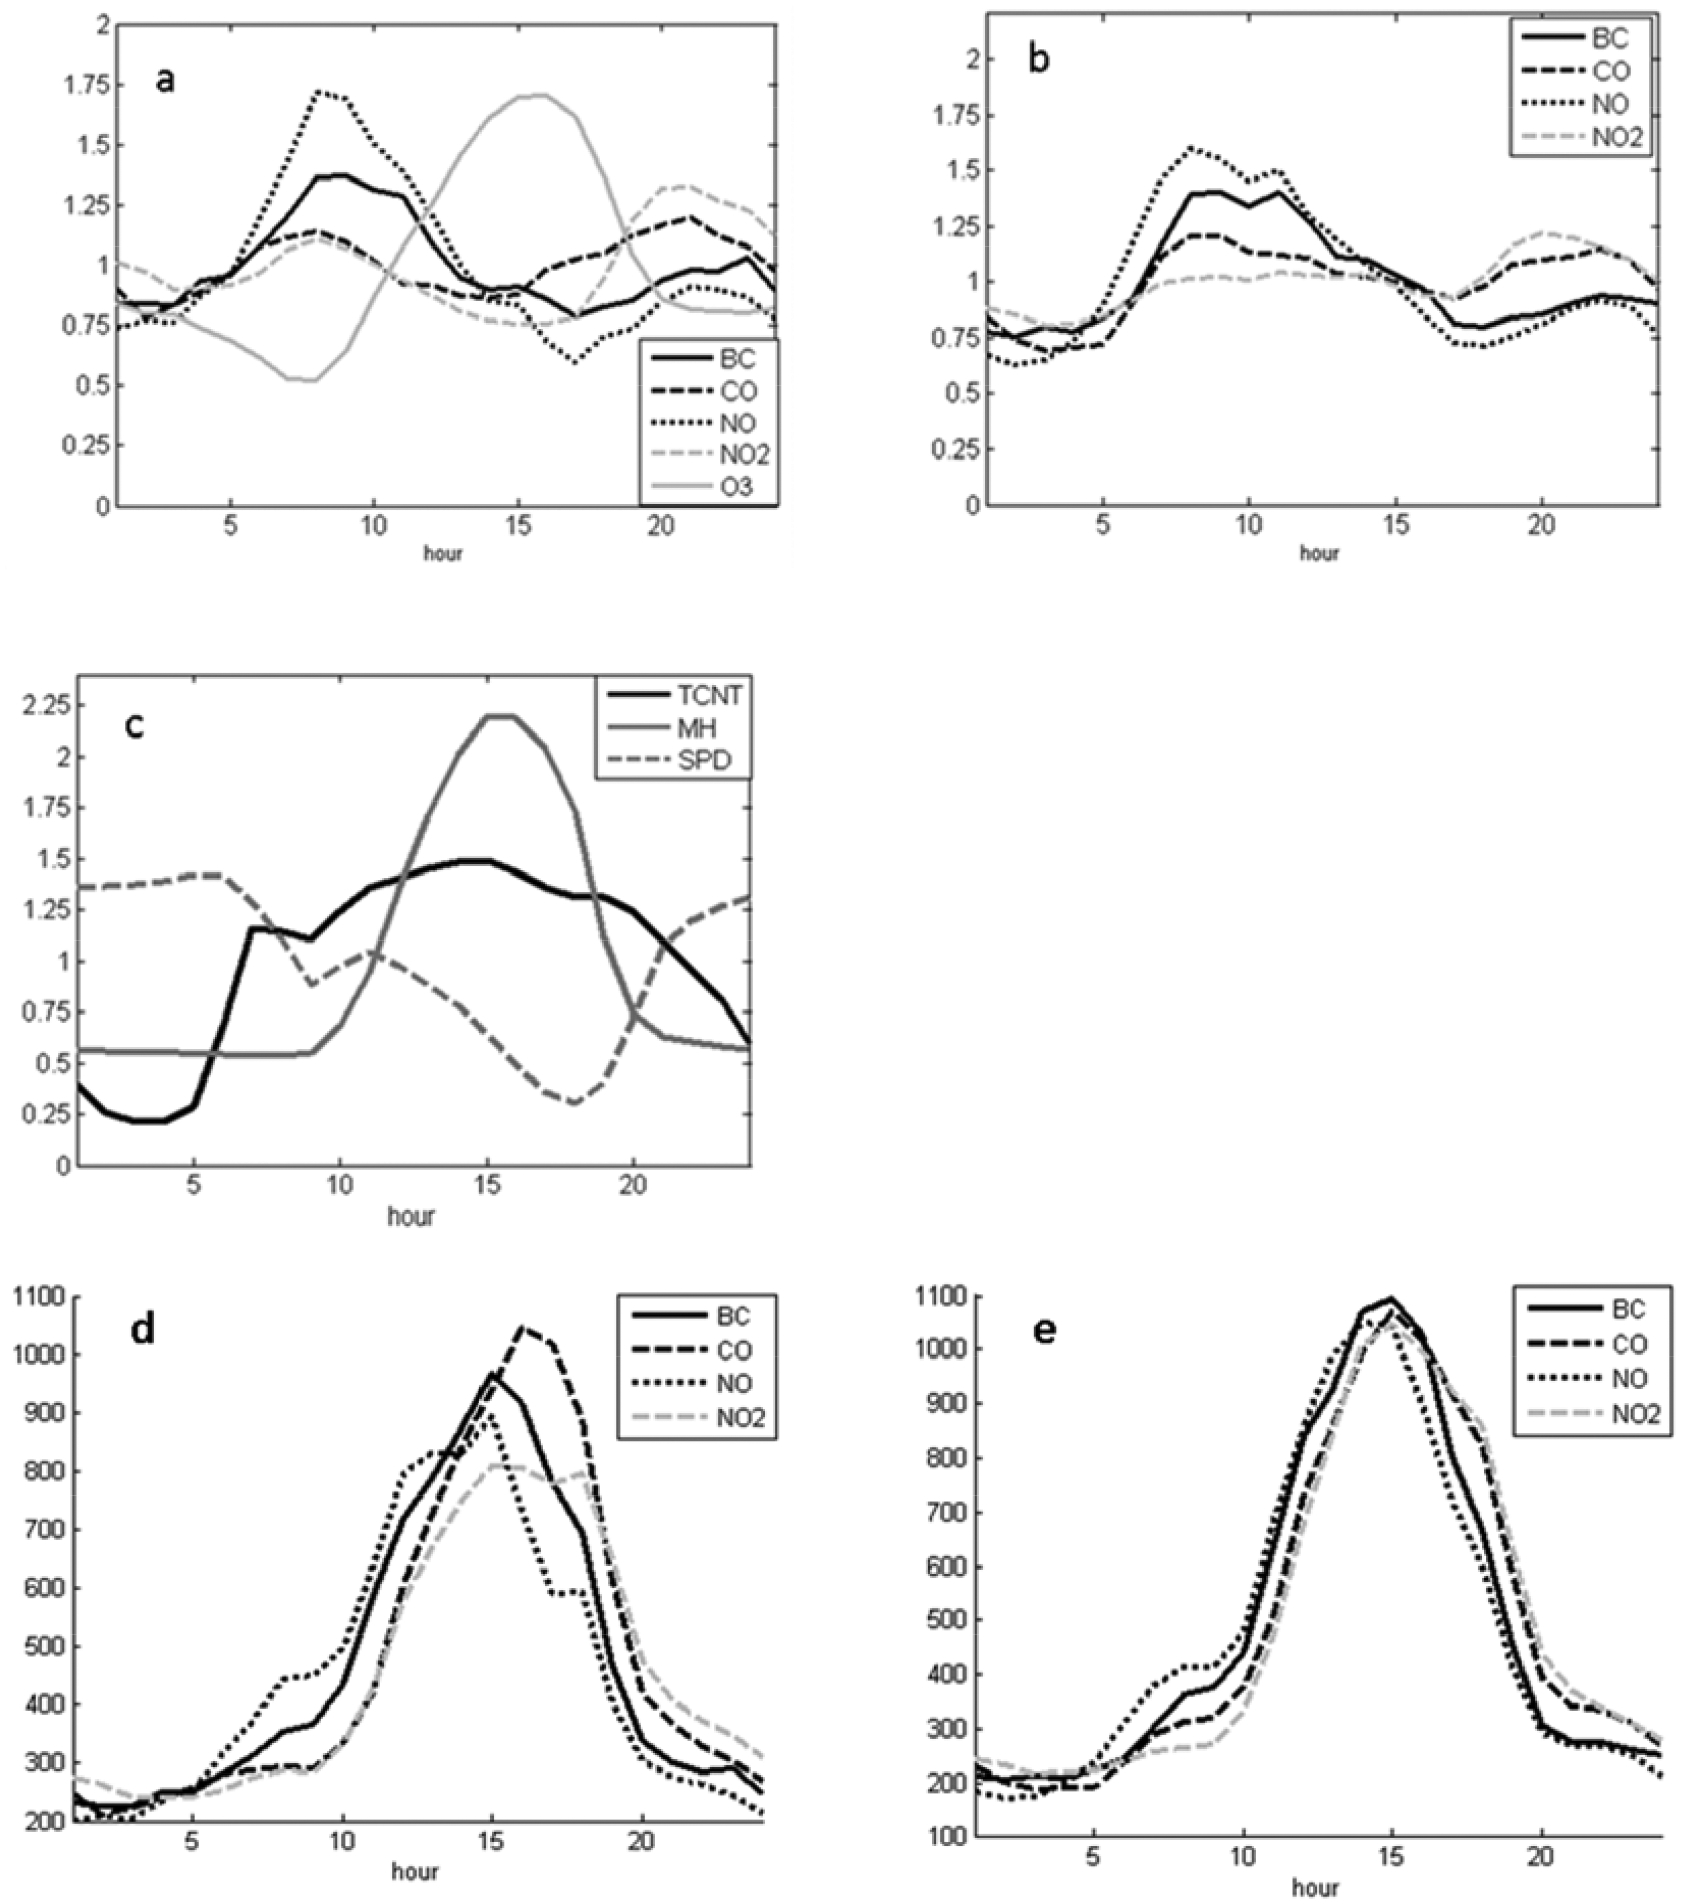
Hourly mean (a) NR DRIVE concentration data, (b) NR GIT concentration data, and (c) traffic parameter data normalized by mean. (d) NR DRIVE concentration normalized by mean and multiplied by mixing height. (e) NR GIT concentration normalized by mean and multiplied by mixing height. Data from September 8, 2014 to January 5, 2015. TCNT: Traffic count, MH: Mixing height, SPD: Traffic highway speed.