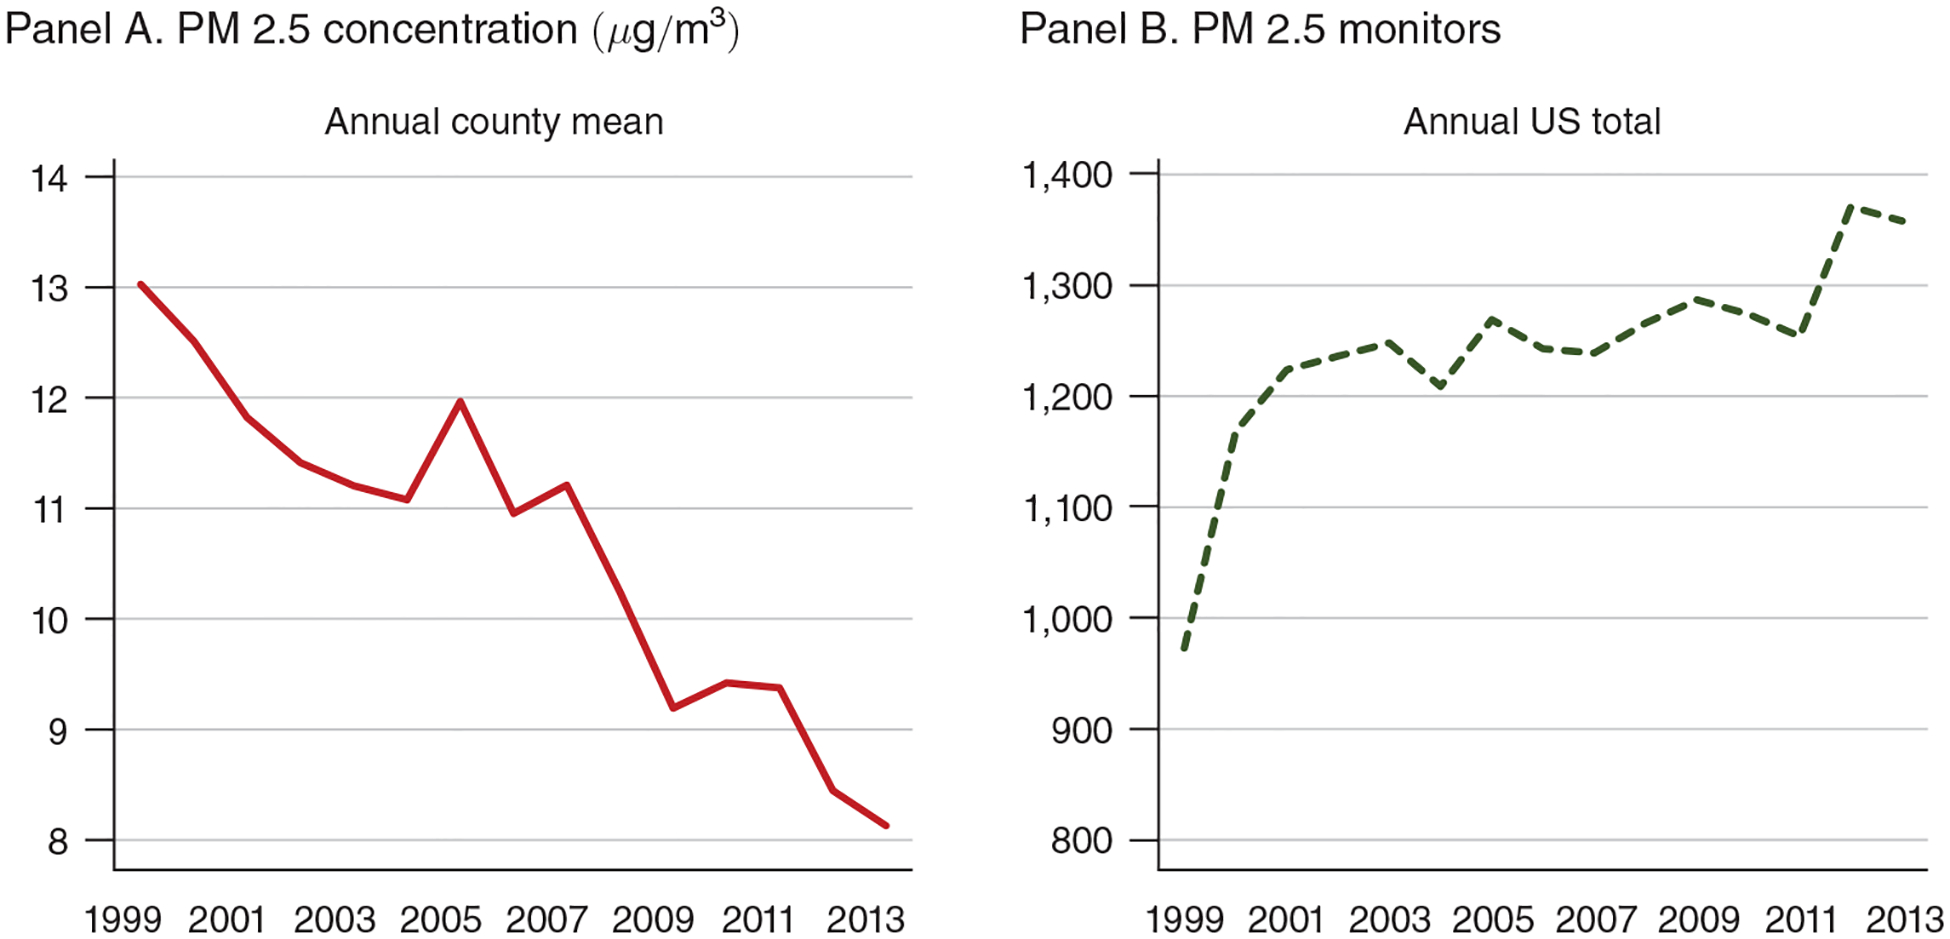
Figure 1. Trends in PM 2.5 Air Pollution and Monitoring, 1999–2013.

Note: The figure displays annual county means for PM 2.5 concentration (panel A) and the nationwide total number of PM 2.5 monitors (panel B).

Note: The figure displays annual county means for PM 2.5 concentration (panel A) and the nationwide total number of PM 2.5 monitors (panel B).