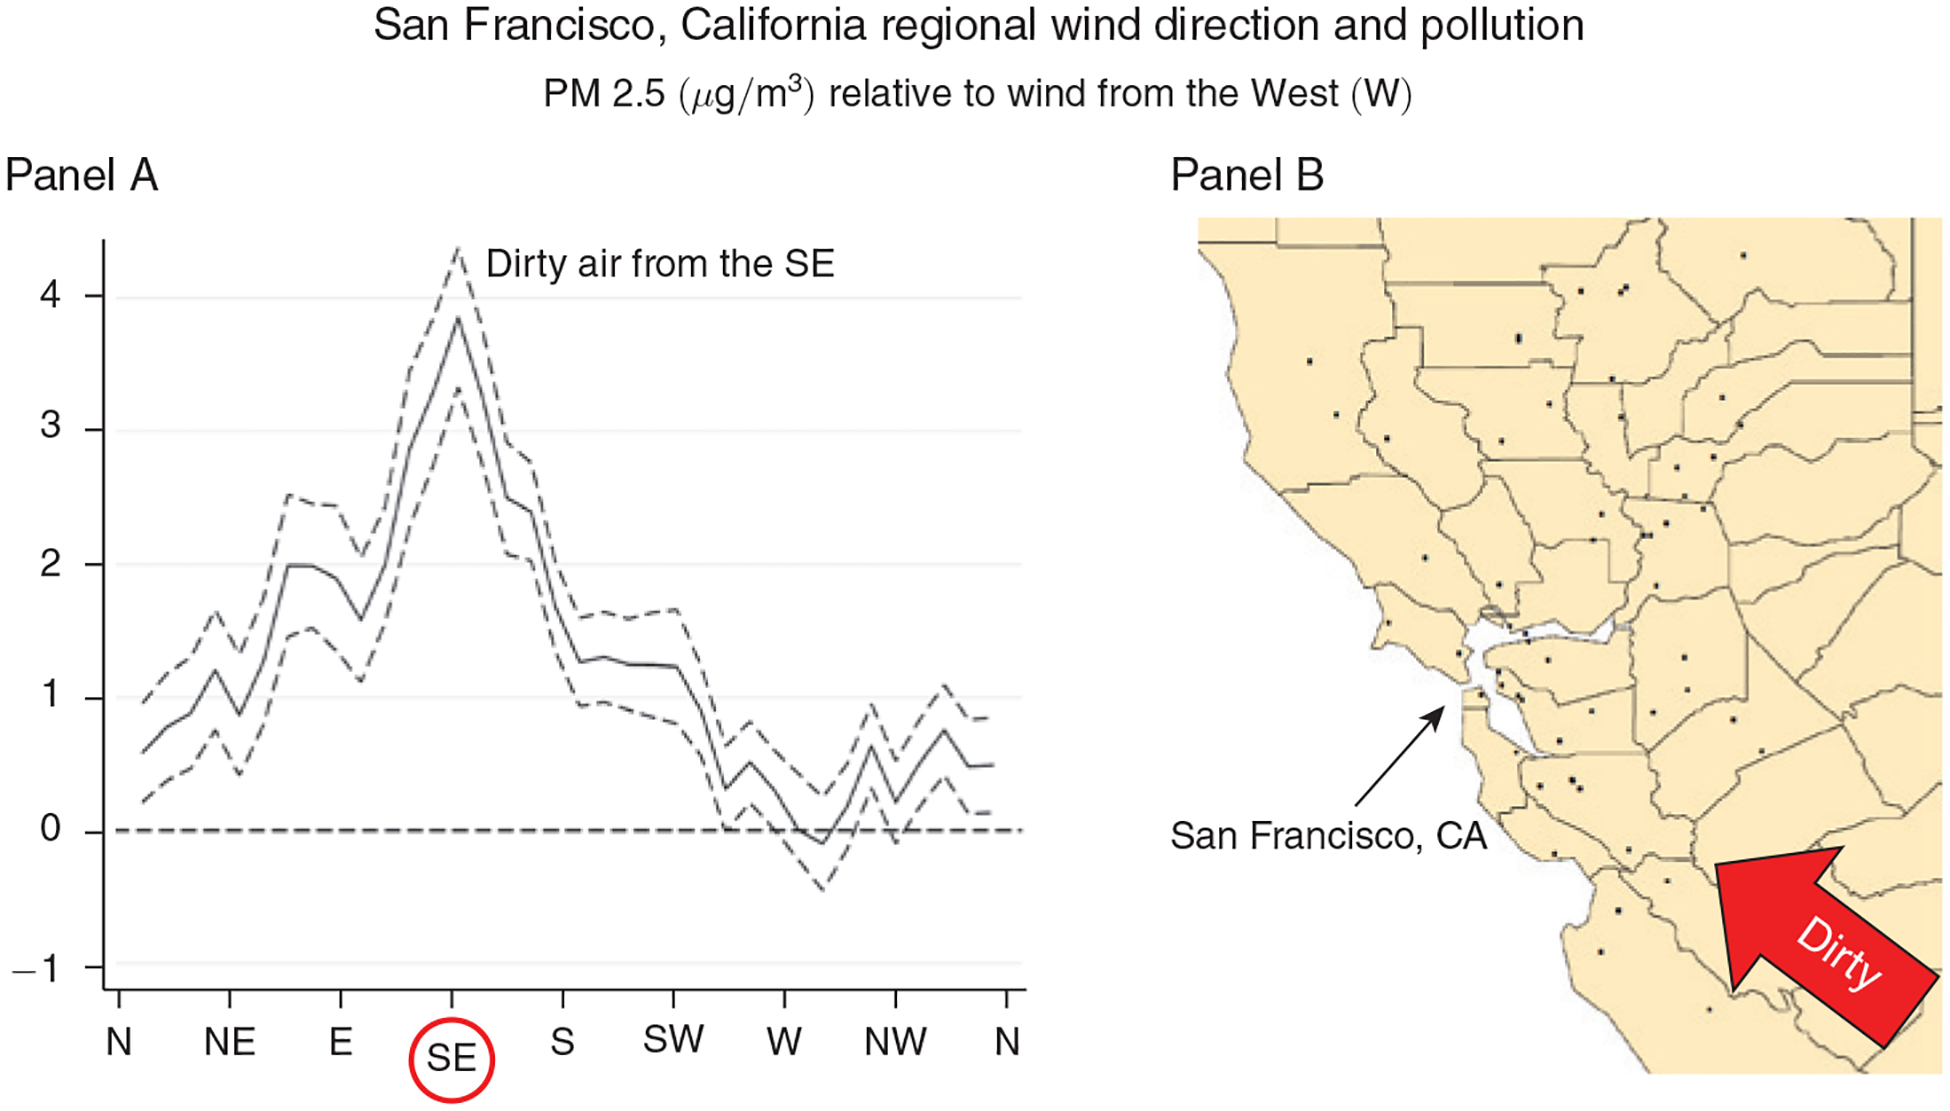
Figure 2. Relationship between Daily Average Wind Direction and PM 2.5 Concentrations for Counties in and around the Bay Area, CA.

Notes: Panel A shows regression estimates of equation (A1) from the online Appendix, where the dependent variable is the county average daily PM 2.5 concentration and the key independent variables are a set of indicators for the daily wind direction falling into a particular 10-degree angle bin. Controls include county, month-by-year, and state-by-month fixed effects, as well as a flexible function of maximum and minimum temperatures, precipitation, wind speed, and the interactions between them. The dashed lines represent 95 percent confidence intervals based on robust standard errors. Panel B shows the location of the PM 2.5 pollution monitors (black dots) in the Bay Area that provided the pollution measures for this regression.
