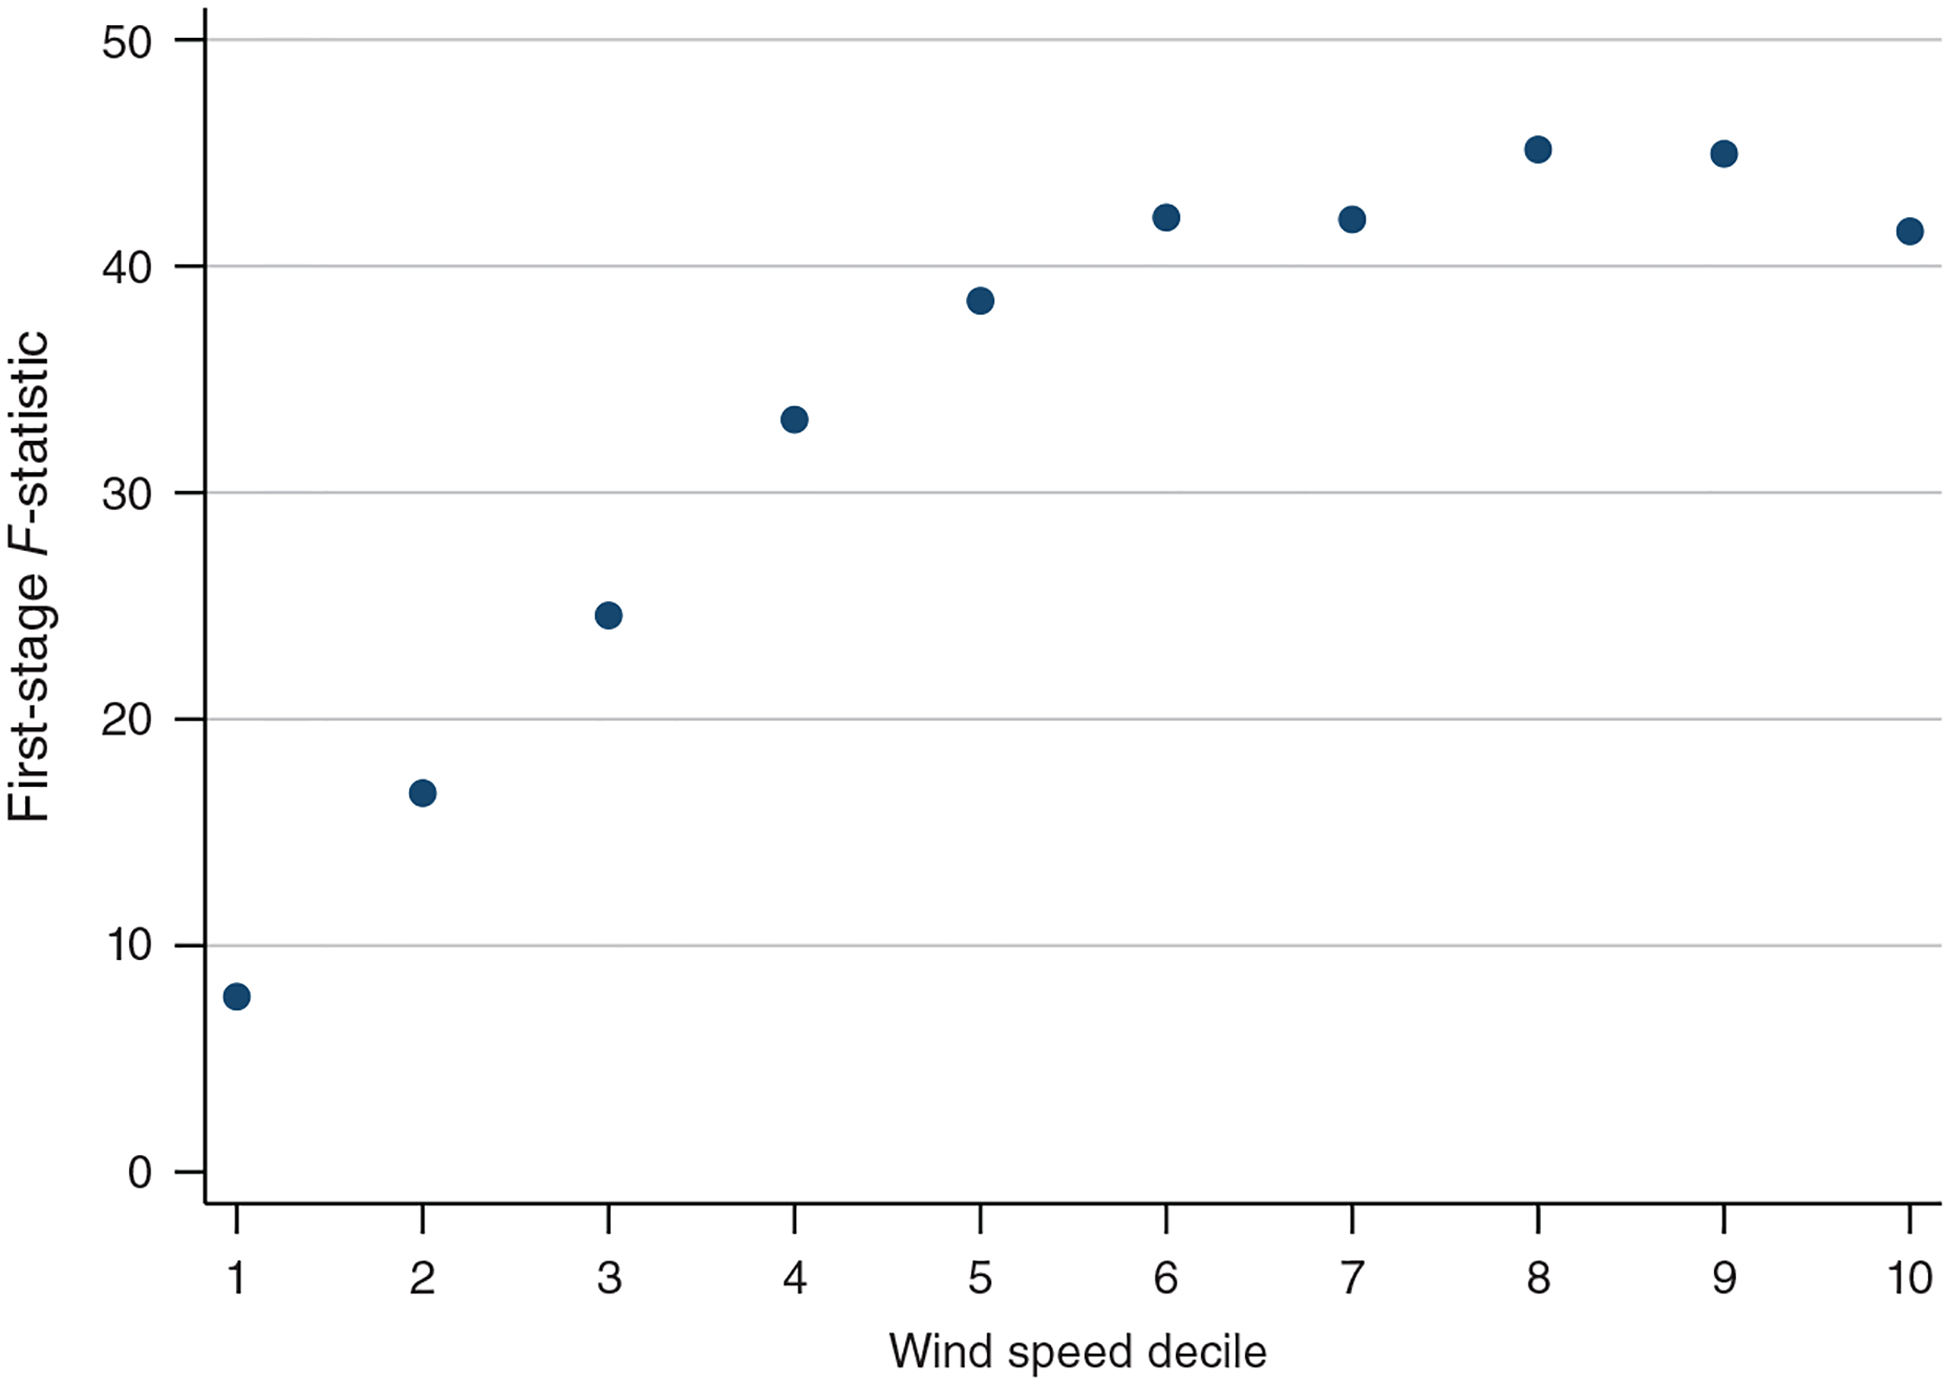
Figure 7. Relationship between the Strength of the First Stage and Wind Speed.

Notes: This figure reports the F-statistic for our first stage (equation (2)) for ten different subsamples that each include only days that fall within a particular wind speed decile. The F-statistic is lowest when the sample is limited to days with low wind speeds.
