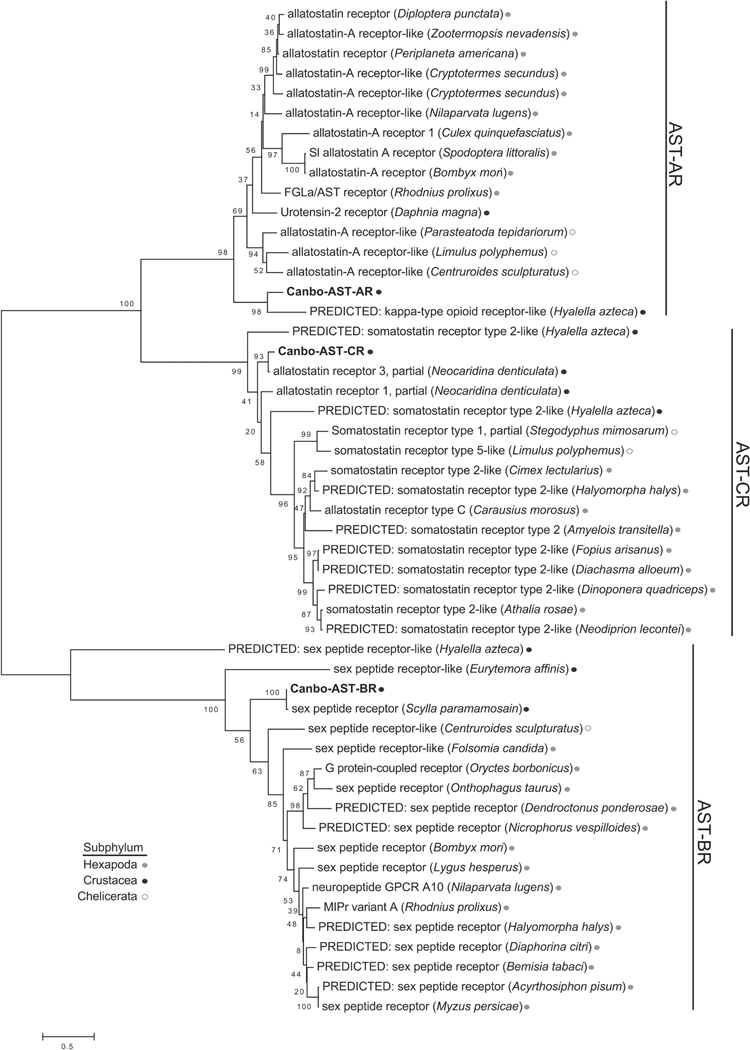
Figure 7.
Phylogenetic analysis of A-, B- and C-type allatostatin receptors from diverse arthropods. Maximum likelihood tree depicting the inferred evolutionary history of the putative Cancer borealis allatostatin receptors with allatostatin-like receptor sequences identified in arthropods from the Hexapoda, Crustacea, and Chelicerata subphyla. The tree with the highest log likelihood is drawn to scale, with branch lengths measured in the number of substitutions per site. The percentage of trees in which the associated taxa clustered together across 1000 replicates is shown next to the branches. Accession numbers for the sequences used for the phylogenetic analysis are provided in Supplemental Table 1.

