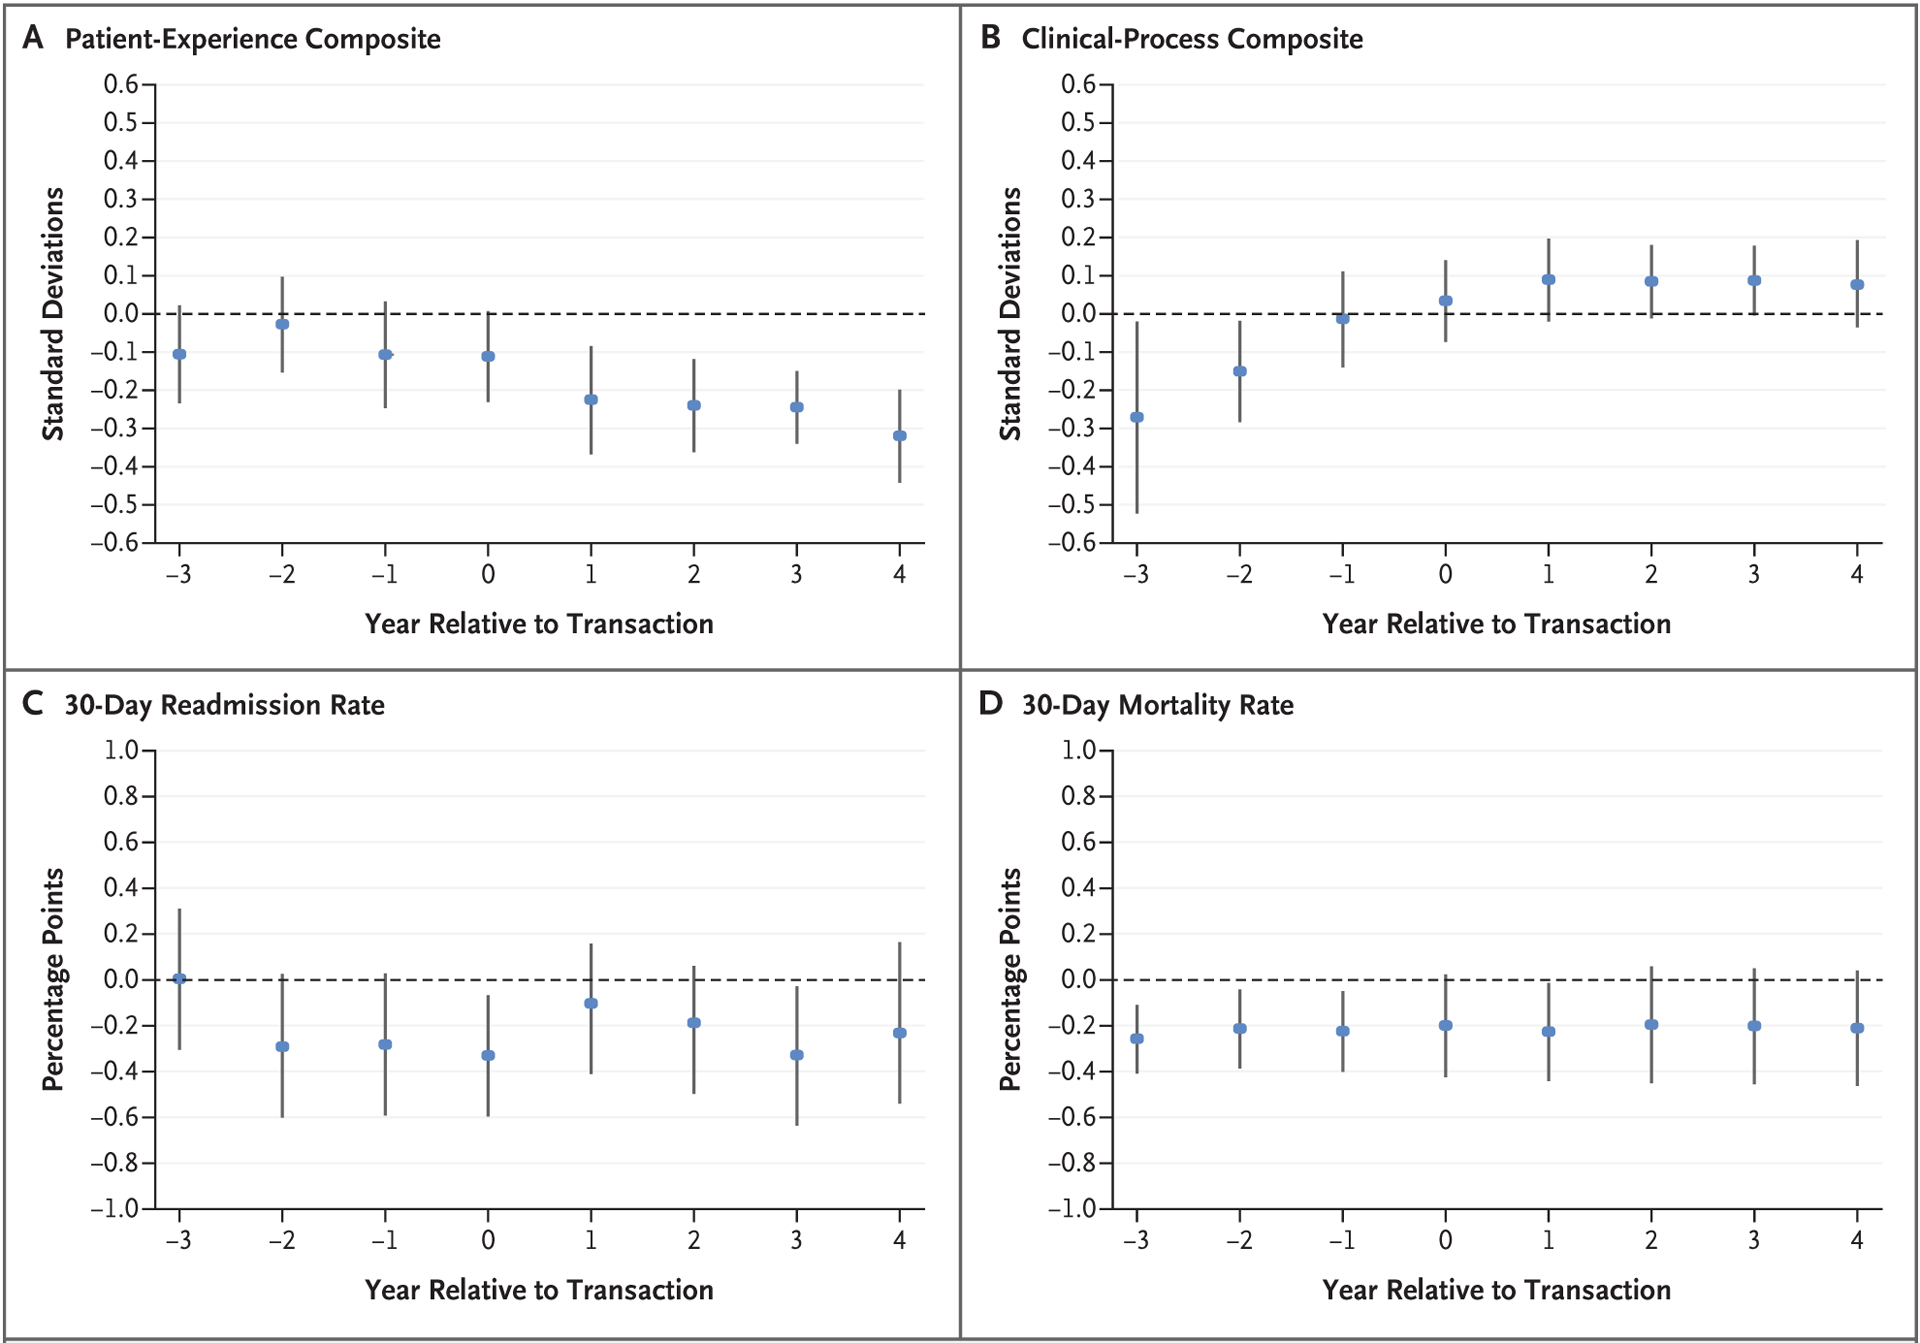
Figure 1. Differences in Performance between Acquired Hospitals and Control Hospitals before and after Acquisition.

The difference in adjusted performance between acquired hospitals and control hospitals is plotted for each year relative to the transaction year, with error bars denoting 95% confidence intervals.
