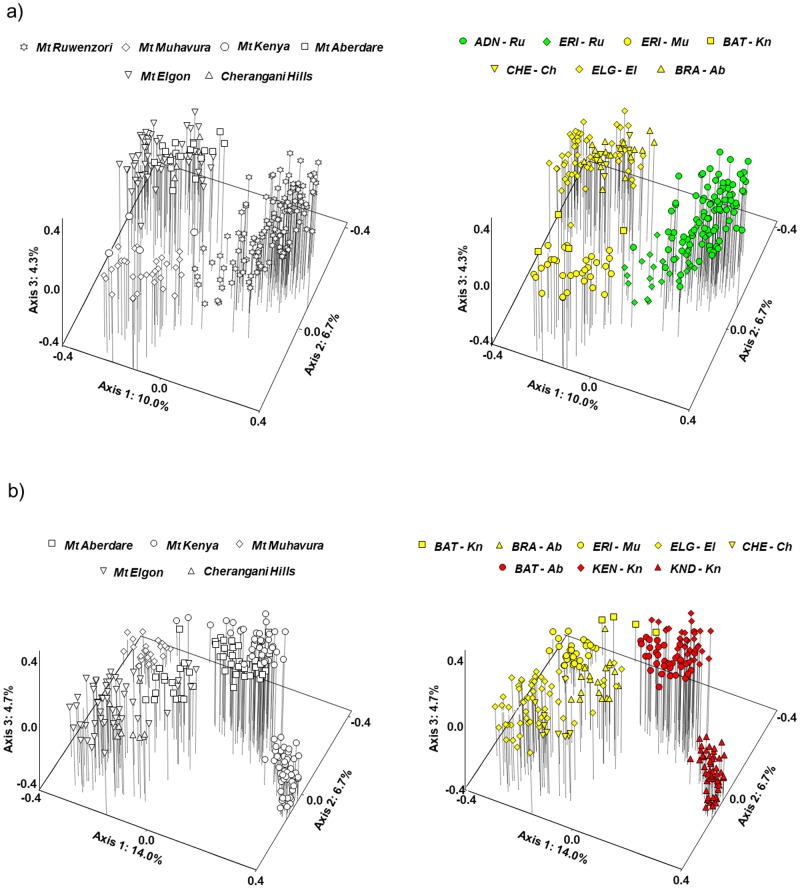
Fig 4. Separate principal coordinates analyses (PCoA) based on Dice’s coefficient of similarity between AFLP phenotypes for subsets of the total dataset to assess details of the admixture between three of the four main genetic groups.
(a) The WRZ-Ruwenzori and WRZ/ERZ genetic groups; (b) The ERZ-Kenya/Aberdare and WRZ/ERZ genetic groups. Plots to the left show mountains, plots to the right show taxonomic annotations. Abbreviations as in Fig 2.

