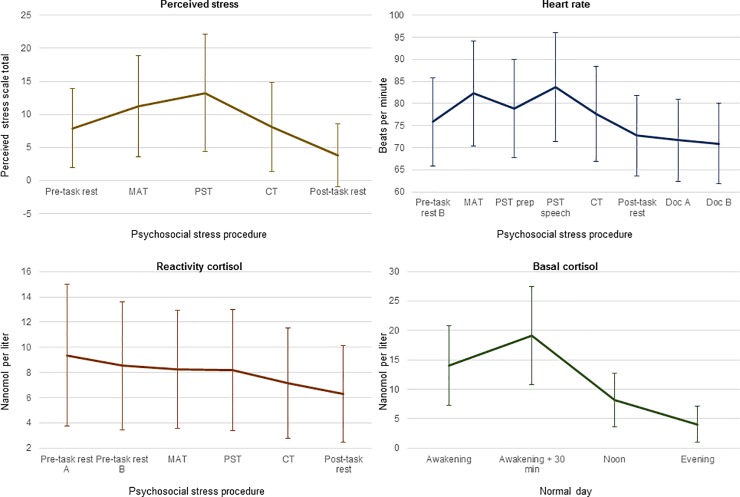
Fig 2. Means and standard deviations of all perceived and (raw) biological stress indices.
Lines refer to means and error bars to standard deviations of all perceived (top left) and biological (heart rate: top right, reactivity cortisol: bottom left, basal cortisol: bottom right) stress indices. The evening measurement of basal cortisol was taken at 20.00. MAT = mental arithmetic task, PST = public speaking task, CT = computer task, prep = preparation, Doc = documentary.

