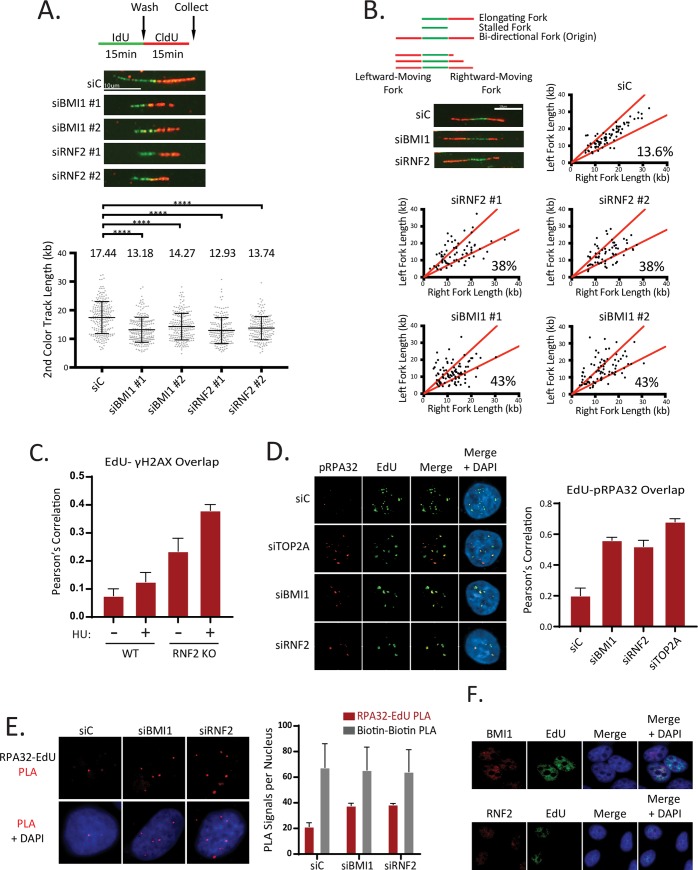
Fig 2. BMI1 and RNF2-deficiency causes increased replication fork stress.
A. (Top) Schematic for measuring replication fork speed by the DNA fiber analysis. RPE1 cells were labeled sequentially with IdU and CldU for 15 minutes each. Representative DNA fibers in each siRNA-transfected sample. (Bottom) Quantification of 2nd color track length in each siRNA-transfected sample. Numbers on top of the graph indicate average track length (N = 180 from 3 biological replicates for each knockdown). B. (Top) Schematic for measuring bi-directional (or asymmetric) fork arrest in the DNA fiber assays. Representative images are shown. (Bottom) Knockdown of BMI1 or RNF2 increases replication fork asymmetry in RPE1 cells. Cells were labeled with IdU and CldU as in A. C. Co-staining of EdU and γH2AX showing increased intensities of γH2AX in EdU-positive cells when the RNF2 KO cells are treated with 2mM HU. The overlap between EdU and γH2AX is represented as the Pearson’s correlation coefficient. (N = 50 from 2 biological replicates). D. (Left) Co-staining of EdU and p-RPA32 demonstrates that intermediate replication structures (e.g. ssDNAs) are increased in BMI1, RNF2 and TOP2A knock down T80 cells. (Right). Quantification of overlap between EdU and RPA32 by the Pearson’s correlation coefficient. (N = 75 from 3 biological replicates). E. (Left) Representative images showing that the PLA signals between EdU and RPA32 are increased in U2OS cells depleted of BMI1 or RNF2. (Right) Quantification of average PLA signals per nucleus. Biotin-biotin PLA signals are unchanged under the given conditions. (N = 50 from 3 biological replicates). F. Co-staining of BMI1 (Top) or RNF2 (Bottom) with EdU confirms these proteins are expressed in the nucleus during S phase.

