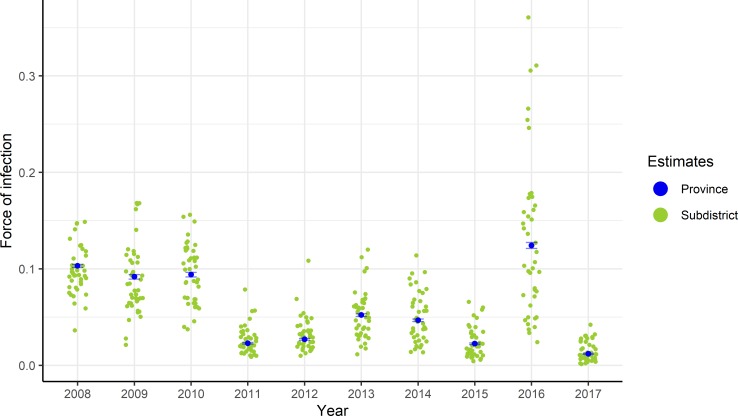
Fig 2. Total force of infection (4λ) estimates obtained from the fit of model 2 variant PS (assuming reported hospitalised DHF cases are caused by primary or secondary infections) to annual DHF cases reported between 2008 and 2017.
Blue points show the median and the bars the 95% credible interval of the estimates obtained for the whole province of Jakarta. Green points represent the yearly median estimates obtained at the subdistrict level. Annual subdistrict parameter estimates are available in S2 File.

