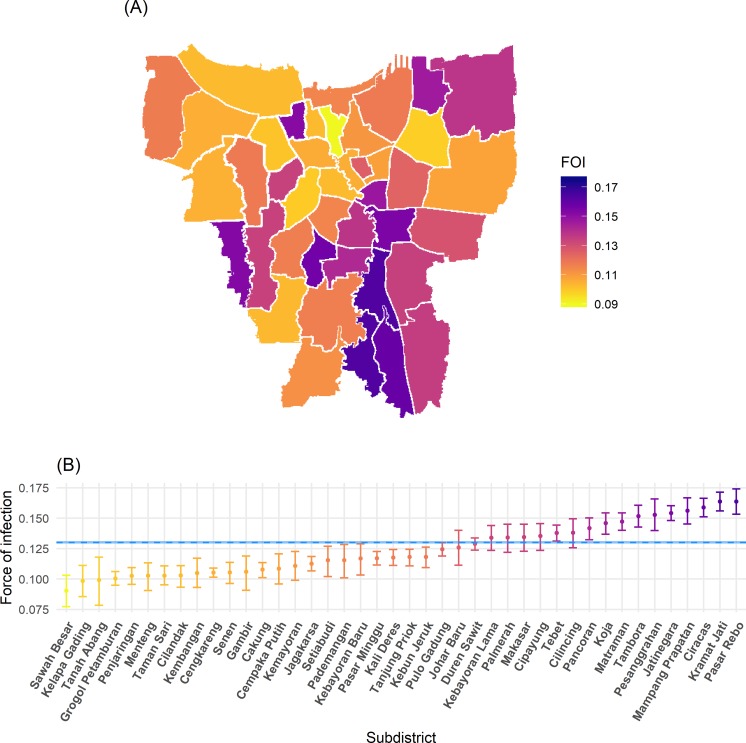
Fig 3. Spatial variation in average annual total dengue force of infection (4λ) estimates in Jakarta obtained from the fit of model 1 variant PS (assuming reported hospitalised DHF cases are caused by primary or secondary infections) to average annual hospitalised DHF data reported in 2008–2017.
(A) Map of median force of infection estimates per subdistrict; (B) median and 95% credible interval of the estimates reported in panel A. Blue dashed line and shading shows the median and 95% credible interval province-level average annual force of infection in 2008–2017. FOI: force of infection. Boundaries were obtained from Wikimedia Commons under a CC-BY 3.0 NL license and converted to shapefile format using QGIS (25,26).

