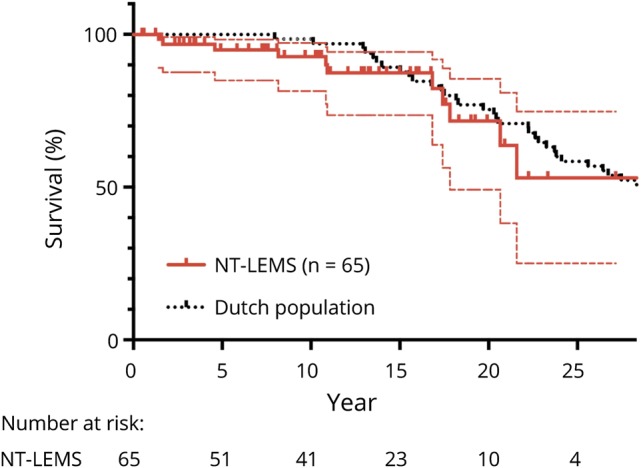
Figure 1. Survival of NT-LEMS compared to matched Dutch life expectancy.

Kaplan-Meier curve showing survival of patients with Lambert-Eaton myasthenic syndrome without an associated tumor (NT-LEMS) compared to the average life expectancy in the Netherlands after adjustment for sex, age, and year of diagnosis. Dotted thin lines represent 95% confidence interval, and small vertical lines represent censored data for the patients with LEMS.
