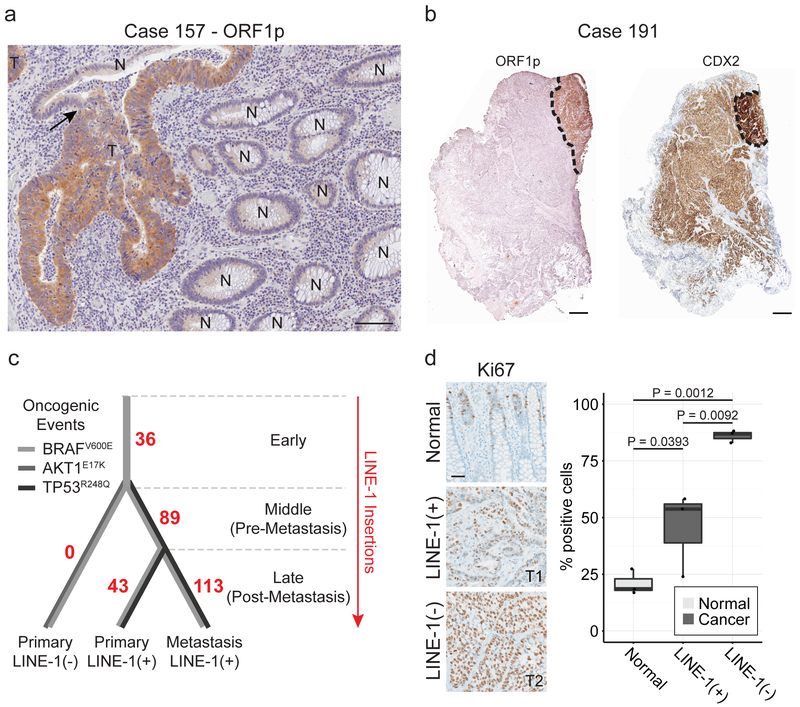
Figure 1. Heterogeneous LINE-1 expression in colon cancer.
(a) ORF1p immunohistochemistry stain of formalin-fixed paraffin-embedded (FFPE) colon cancer tissue. LINE-1 immunostaining is seen in tumor (T) and not in normal colonic epithelium (N). The arrow indicates a transition from normal to tumor within a gland. Scale bar = 50 μm. (b) Immunohistochemistry stain of FFPE colon cancer tissue from patient case 191. Left, low magnification of ORF1p intensely-positive and negative tumor sectors. Right, low magnification of CDX2, a colon epithelium marker. LINE-1(+) cells express higher CDX2 and are gland-forming whereas LINE-1(−) cells express lower CDX2 and do not form glands. Scale bars = 500 μm. (c) Phylogenetic tree of the tumor subclones in case 191 based on TIP-seq and known tumor driver alleles. The number of de novo LINE insertions is indicated along the line edges (red). We genotyped by Sanger sequencing known tumor driver alleles and found an AKT1E17K mutation in the CDX2-dim cells and a TP53R248Q mutation in CDX2-high cells (both primary and metastatic sites). All tumor specimens possessed a BRAFV600E allele regardless of LINE-1 expression status. The color of the lines indicates the presence or absence of known tumor driver alleles. (d) Ki67 quantification of normal epithelium, LINE-1(+) glandular cancer, and LINE-1(−) solid cancer in case 191. The percent of positive cells was calculated as the number of Ki67+ nuclei divided by the total number of epithelial cell nuclei. Three independent high-powered fields were counted per tissue morphology, and results were compared with ANOVA and two-sided T tests. Scale bar = 100 μm.

