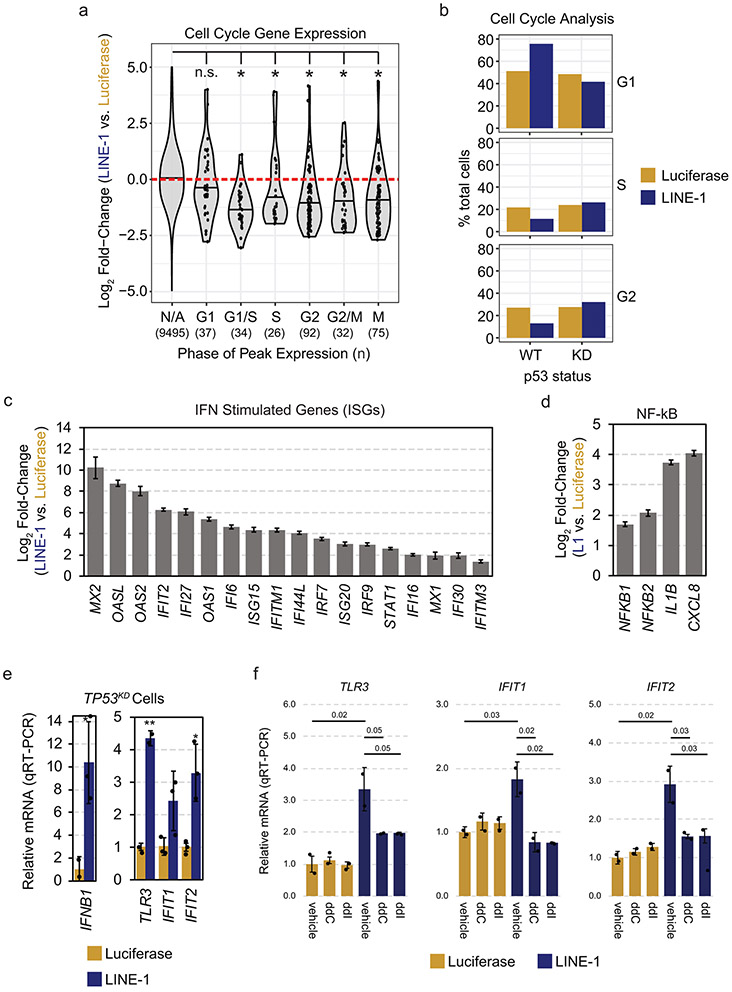
Extended Data Fig. 3. LINE-1 RNAseq analysis.
(a) Genes regulated by cell cycle were curated from CycleBase v3.081 and differential expression values were plotted. S, G2, and M phase genes were significantly downregulated in LINE-1(+) cells. Unpaired two-sided T tests were used for statistical testing. N/A = not applicable. *p-values vs. N/A: G1 = not significant (n.s.), G1/S = 1.7e-9, S = 1.5e-2, G2 = 2.1e-13, G2/M = 5.2e-6, M = 3.4e-10. (b) Flow cytometry was used to assess cell cycle by quantifying DNA content using a PI DNA stain in Tet-On LINE-1 or Tet-On luciferase cells induced with 1 μg/ml doxycycline for 48 hours. LINE-1(+) cells with wildtype (WT) p53 accumulated in G1 phase (2n DNA copy number), whereas TP53 knockdown (KD) resulted in more even cell cycle proportions. These data are from one experiment. (c) Relative fold-change of interferon-stimulated genes in LINE-1 compared to luciferase-expressing cells measured by RNAseq. Error bars indicate SEM. (d) RNAseq analysis revealed upregulation of NF-kB and several target genes in LINE-1(+) cells. Error bars indicate SEM. (e) Differential expression of IFNB1 (right) and interferon-stimulated genes (left) in p53-knockdown cells expressing LINE-1 or luciferase for 72 hours. Measured by qRT-PCR. Error bars indicate SD, n=3 biological replicates. * p < 0.05, ** p < 0.001. (f) Differential expression of TLR3, IFIT1, and IFIT2 with the addition of 5μM zalcitabine (ddC) or 5μM didanosine (ddI) in p53-knockdown cells expressing LINE-1 or luciferase for 72 hours. Measured by qRT-PCR, n=3 independent experiments. P values indicated within the plots.

