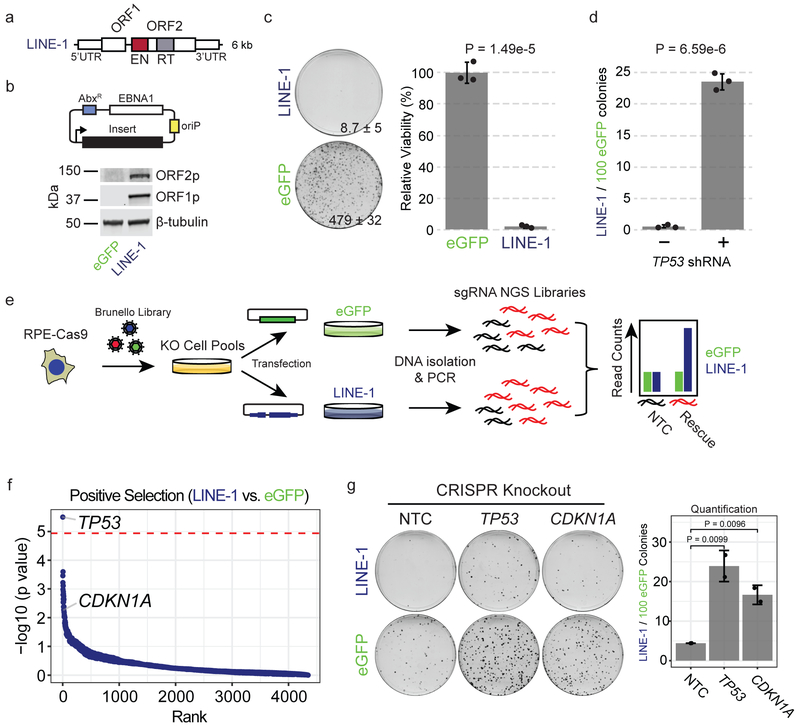
Figure 2. LINE-1 inhibits cell growth in RPE by activating the p53-p21 pathway.
(a) LINE-1 sequence. The 5’ untranslated region (UTR) is a CpG-rich RNA polymerase II promoter. Open reading frame (ORF) 1 and ORF2 are separated by a 63 bp linker sequence. ORF2 has endonuclease (EN, red) and reverse transcriptase (RT, gray) domains. (b) Above, episomal pCEP4 mammalian expression vector for eGFP (pDA083) or LINE-1 (pDA077). AbxR = antibiotic selection marker, EBNA1 = Epstein-Barr Nuclear Antigen 1, oriP = EBNA-1 replication origin. Below, western blot of ORF1p and ORF2p from RPE cells transfected with each plasmid. Uncropped blot is shown in Supplementary Data 1. (c) Clonogenic assay (day 12). Cells are transfected with eGFP (pDA083) or LINE-1 (pDA077). Representative plates with number of colonies indicated ± SD. Quantification to the right is normalized to eGFP-expressing cells set at 100%, with n=3 independent experiments. P value calculated by two-sided unpaired T test. (d) Clonogenic assay (day 12). Cells are treated with lentivirus encoding TP53 shRNA (+) or control vector (−). Data presented as the rate of LINE-1 per 100 eGFP colonies ± SEM, n=3 independent experiments. P value obtained by unpaired two-sided T test. (e) Positive Selection CRISPR-Cas9 knockout screen workflow using the Brunello CRISPR knockout library. RPE-Cas9 = RPE cells constitutively expressing Cas9 protein. KO = knockout. sgRNA = single-guide RNA. NGS = Next-Generation Sequencing. NTC = Non-targeting-control. (f) Screen enrichment rank vs. significance values of gene knockouts that rescue growth of LINE-1(+) cells. The red line is the FWER-adjusted genome-wide significance level. Low ranks indicate rescue of LINE-1(+) cells. (g) CRISPR knockout of TP53 or CDKN1A significantly rescue growth of RPE compared to non-targeting-control (NTC). Representative plates with all data presented as LINE-1 / 100 eGFP colonies ± SEM. n=2 biological replicates. P value obtained by unpaired one-sided T test.

