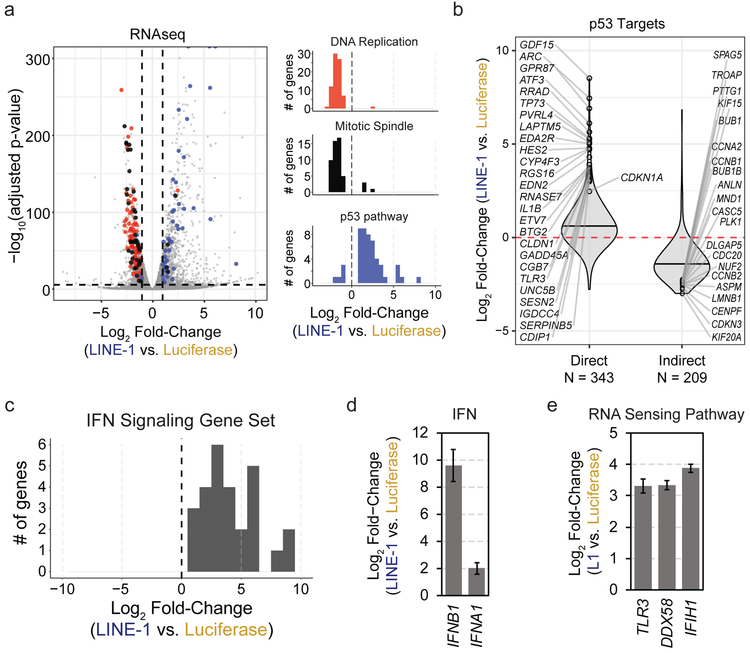
Figure 3. LINE-1 activates a p53 and IFN response.
(a) Left: Volcano plot of differentially expressed genes. Vertical dashed lines indicate fold-change of −1 or 1 (log2) and the horizontal dashed line indicates a FWER-controlled p-value of 0.05. Right: histograms of gene set enrichment analysis results. Gene set names are indicated above each plot. The number of genes is indicated on the y-axis and the x-axis indicates differential expression bins. Individual genes comprising these datasets are highlighted in the volcano plot according to the colors of the bars in the histograms. Data derived from n=3 independent replicates. (b) Violin plots illustrating differential expression of p53 transcriptional targets. Direct and indirect target genes are curated from published reports (see Methods References). Horizontal bars mark median values. The number of genes in each group are indicated below the plot. (c) Histogram of gene set enrichment results of interferon (IFN) signaling genes. The number of genes is indicated on the y-axis and the x-axis indicates differential expression. (d) Relative fold-change of interferon B1 (IFNB1) and A1 (IFNA1) in LINE-1(+) compared to luciferase(+) cells measured by RNAseq. Error bars indicate SEM. (e) RNAseq analysis revealed upregulation of the RNA sensing pathway involving Toll-like receptor 3 (TLR3), RIG-I (DDX58), and MDA5 (IFIH1) in LINE-1(+) cells. Error bars indicate SEM.

