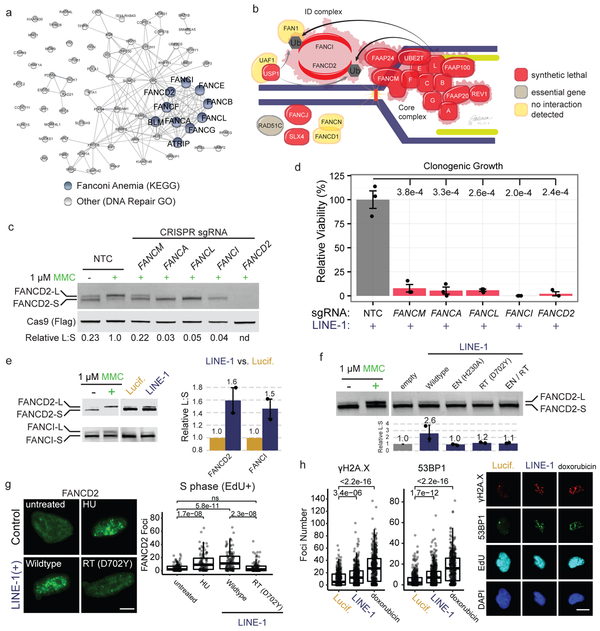
Figure 5. The Fanconi Anemia (FA) pathway is essential in p53-deficient cells.
(a) Network of 75 DNA repair genes identified in the screen is enriched for Fanconi anemia genes (blue nodes). Edges indicate known physical interactions. (b) Model of FA complexes responding to a DNA lesion (vertical line) encountered by a replication fork (blue line, genomic DNA; green line, nascent DNA). Genes are color coded based on the performance of their knockouts. (c) Western blot of FANCD2 response to 24-hour treatment with 1 μg/ml mitomycin C (MMC). Cells are treated with FA member sgRNAs or non-targeting-control (NTC). FANCD2 monoubiquitination assessed as the ratio of FANCD2-L (long) to FANCD2-S (short) band intensities (relative L:S ratio) graphed relative to NTC, MMC-treated cells. nd = not determined. (d) Clonogenic growth assay of LINE-1(+) RPE cells with sgRNAs targeting the same genes as in (C). n=3 independent experiments. P value calculated with a one-sided T test. (e) Representative western blot of FANCD2 and FANCI following 72 hour expression of LINE-1 or luciferase in RPE. MMC treatment reveals L (monoubiquitinated) and S (non-ubiquitinated) protein bands. Quantification at right of n=2 independent experiments ± SEM.. (f) Representative western blot of FANCD2 following 72 hour expression of wildtype or mutant LINE-1 in HeLa cells. Quantification below of n=2 independent experiments ± SEM. Effect of wildtype LINE-1 as assessed by ANOVA (p = 0.0143). (g) Left, representative images of FANCD2 foci (green) in EdU+ nuclei. Scale bar = 6 μm. Right, quantification of FANCD2 foci in EdU+ HeLa cells. Number of cells per group: untreated, n=134; HU, n=105; wildtype, n=109; RT (D702Y), n=101. HU = hydroxyurea. RT = reverse transcriptase. ns = not significant. (h) Left, γH2A.X and 53BP1 focus quantification in EdU+ TP53KD cells. Number of cells per group: Lucif., n=326; LINE-1, n=358; doxorubicin, n=431. Two-sided T tests were used for statistical comparisons in panels g and h. Right, representative images of γH2A.X (red), 53BP1 (green), EdU (cyan), and DAPI (blue). Scale bar = 12 μm. Uncropped blot images of panels c, e and f are shown in Supplementary Data 1.

