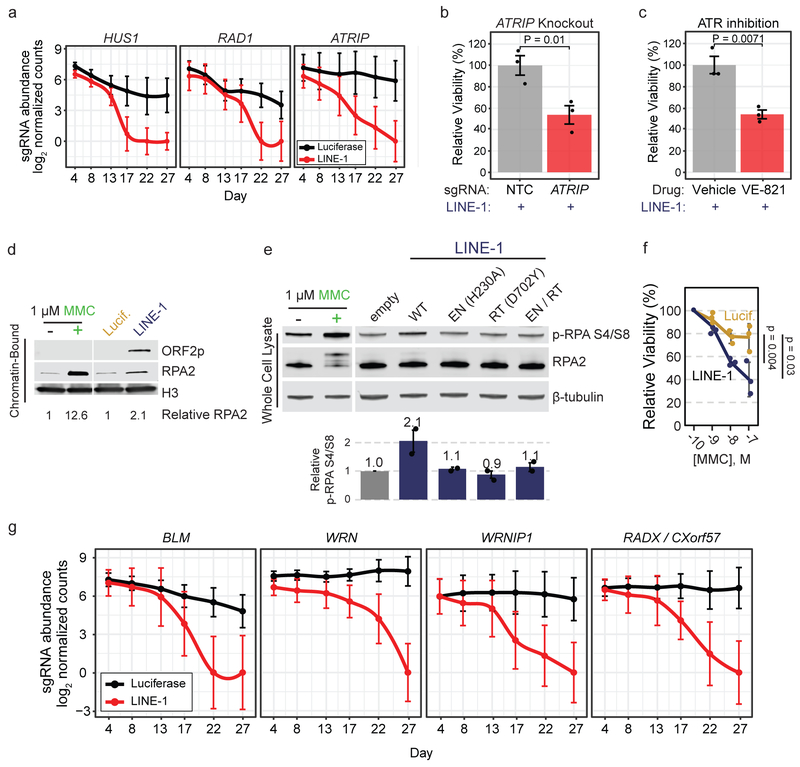
Figure 6. LINE-1 activity induces replication stress.
(a) Median count of sgRNAs targeting replication stress signaling genes ATRIP and the 9-1-1 complex (HUS1 and RAD1) during the screen. Error bars indicate 95% confidence intervals. (b) Clonogenic assay of LINE-1(+) RPE cells (induced with 1 μg/ml doxycycline) with CRISPR-knockout of ATRIP compared to non-targeting-control (NTC). Error bars indicate SEM, n=3 independent experiments. P value is calculated with an unpaired two-sided T test. (c) Clonogenic assay of LINE-1(+) RPE cells (induced with 1 μg/ml doxycycline) with drug inhibition of ATR kinase by 1 μM VE-821 compared to vehicle (DMSO). Error bars indicate SEM, n=3 independent experiments. P value is calculated with an unpaired two-sided T test. (d) Western blot of RPA2 occupancy on chromatin induced by LINE-1 compared to luciferase control after 72 hours of expression in RPE. Chromatin-bound protein lysates were used. 1 μM MMC was used as a control to verify that these cells respond to replication stress. (e) Western blot of p-RPA S4/S8 after 72 hours of wildtype or mutant LINE-1 expression in HeLa cells. Relative signal intensity for n=2 independent experiments ±SEM is quantified. 1 μM MMC was used as a replication stress control and produces a gel shift in total RPA2 that is more subtly produced by WT LINE-1, which is the the hyperphosphorylated protein. Statistical significance is assessed by ANOVA (p = 0.0007). (f) MMC dose-response clonogenic assay of LINE-1(+) cells or control. Molar concentration indicated on x-axis. Data are plotted as the mean viability relative to 100 pM ±SD, n=3 independent experiments. Two-sided T tests were used to compare relative viability at each dose. (g) Median count of sgRNAs targeting fork protection (RADX) and fork restart (BLM, WRN, WRNIP1) genes. Median values are depicted with 95% Confidence Intervals. Uncropped blot images of panels d and e are shown in Supplementary Data 1.

