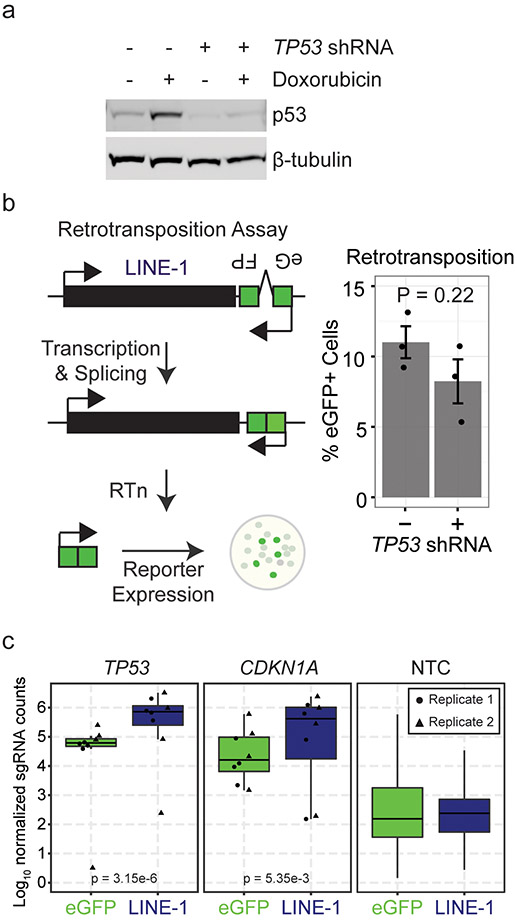
Extended Data Fig. 2. LINE-1 effects on cell growth and retrotransposition.
(a) Demonstration of effective TP53 knockdown. RPE cells were treated with TP53 shRNA lentivirus (DA079) or control lentivirus (DA081). The Western blot shows the p53 response to treatment with the DNA intercalator doxorubicin (200 ng/ml for 24 hours). (b) Left, the retrotransposition reporter assay. LINE-1 is expressed from a plasmid with an antisense eGFP in the 3’UTR that is interrupted by a sense intron. During transcription, the intron is spliced, reconstituting the coding potential of the eGFP reporter. The eGFP reporter carries with it a CMV promoter and is inserted into the genome by LINE-1. Expression of eGFP from the genome allows for fluorescence-based quantification of retrotransposition rate by flow cytometry. Right, reporter assay performed in RPE with TP53 knockdown or control ±SEM, n=3 independent experiments. P value was calculated by two-sided T test. (c) Normalized median read counts of sgRNAs targeting TP53 and CDKN1A in cells expressing either LINE-1 (navy blue) or eGFP (green) control compared to non-targeting-controls (NTC). Individual sgRNAs are indicated by circles or triangles. Results from two biological replicates are depicted.

