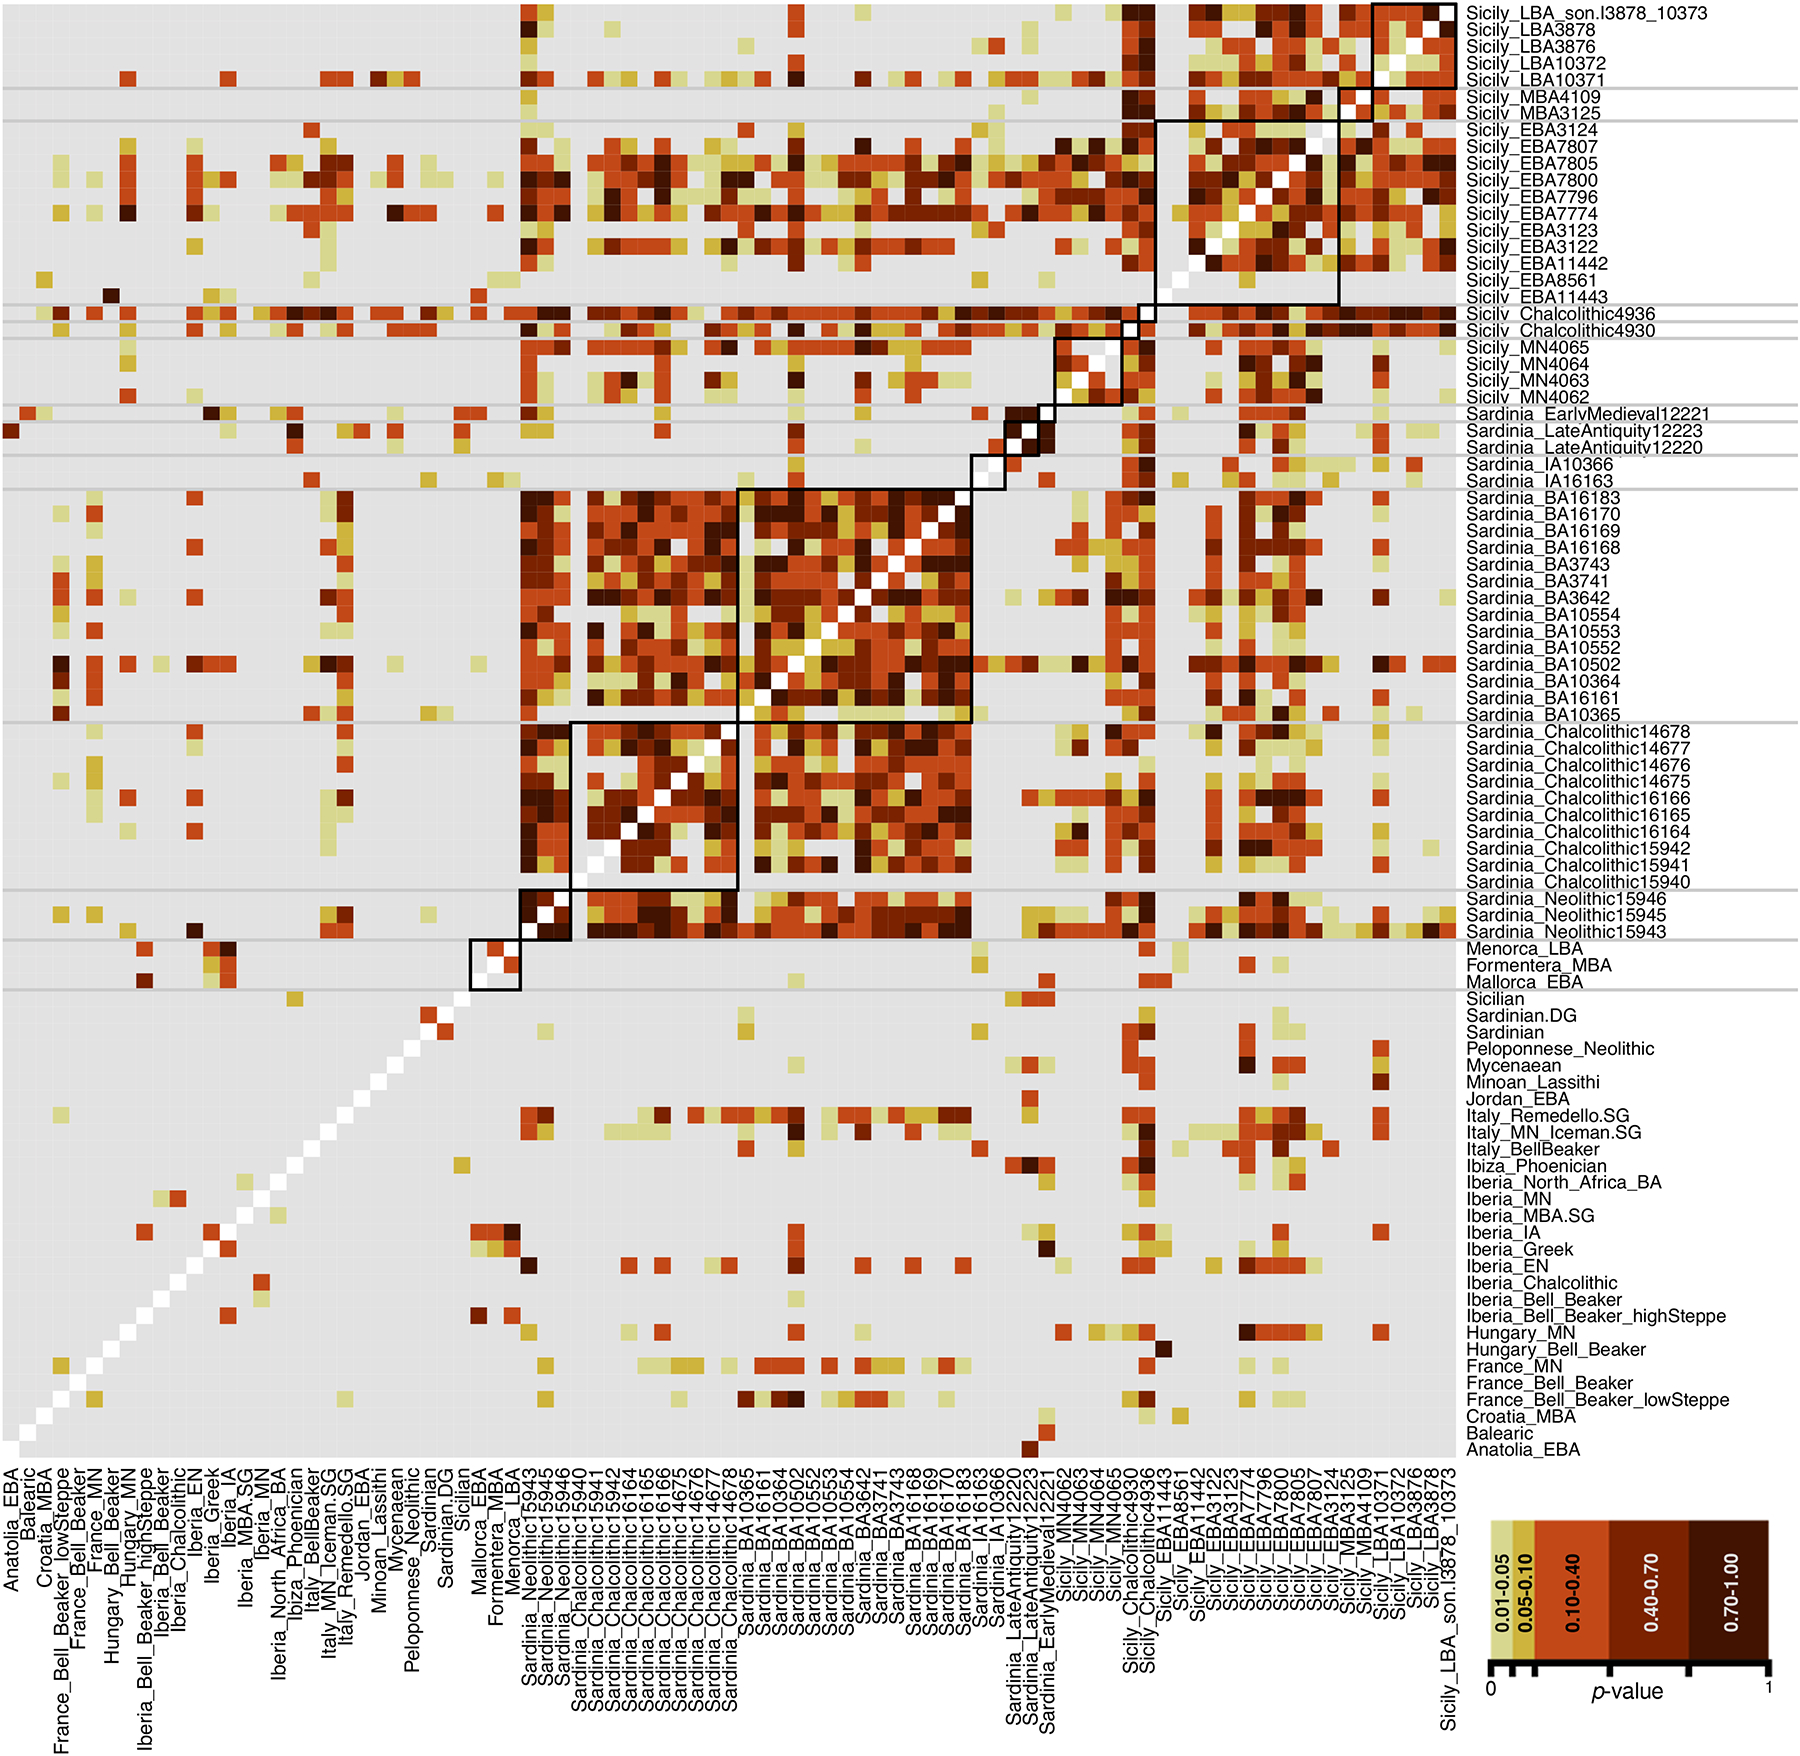
Figure 3: Pairwise qpWave testing to group individuals.

Black lines represent groupings by location and period. Gray-colored models have a P-value below 0.01 and are rejected.

Black lines represent groupings by location and period. Gray-colored models have a P-value below 0.01 and are rejected.