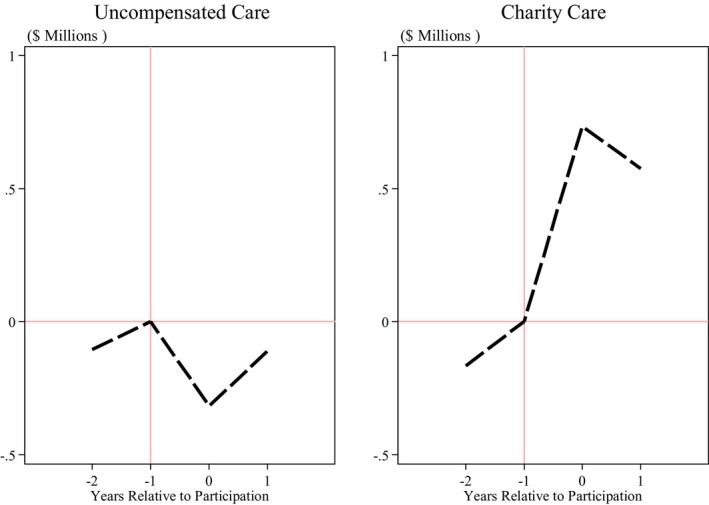
Figure 1.

Average difference in uncompensated care and charity care spending between 340B hospitals and a control group, before and after participation, 2011‐2015.
Note: The figure presents average spending in uncompensated care (left panel) and charity care (right panel) among hospitals that begin participating in 340B over out study period relative to the average value of spending among nonparticipating hospitals. Each point represents the difference between the average for hospitals that begin participating and control group hospitals in the calendar year of observation, averaged across hospitals with differing start dates, and presented in event time where year −1 is the year before the hospital began participating in the program. The figure adjusts for time‐invariant hospital characteristics and common calendar trends by subtracting the hospital‐specific average and year‐specific average from each observation. The sample is limited to nonprofit and public general acute care hospitals that are observed in all 5 y of our sample. Uncompensated care comes from 2011 to 2015 Medicare Cost Report data and is defined as charity care and bad debt charges net of patient payments, deflated by the cost‐to‐charge ratio. Charity care comes from 2011 to 2015 Schedule H, Part 1 data, and is defined as the cost of providing charity care to patients through a written and publicized charity care policy, net of off‐setting revenues such as patient payments. Nonparticipants include hospitals that never participate in 340B as well as hospitals that eventually participate in 340B but have not yet done so
