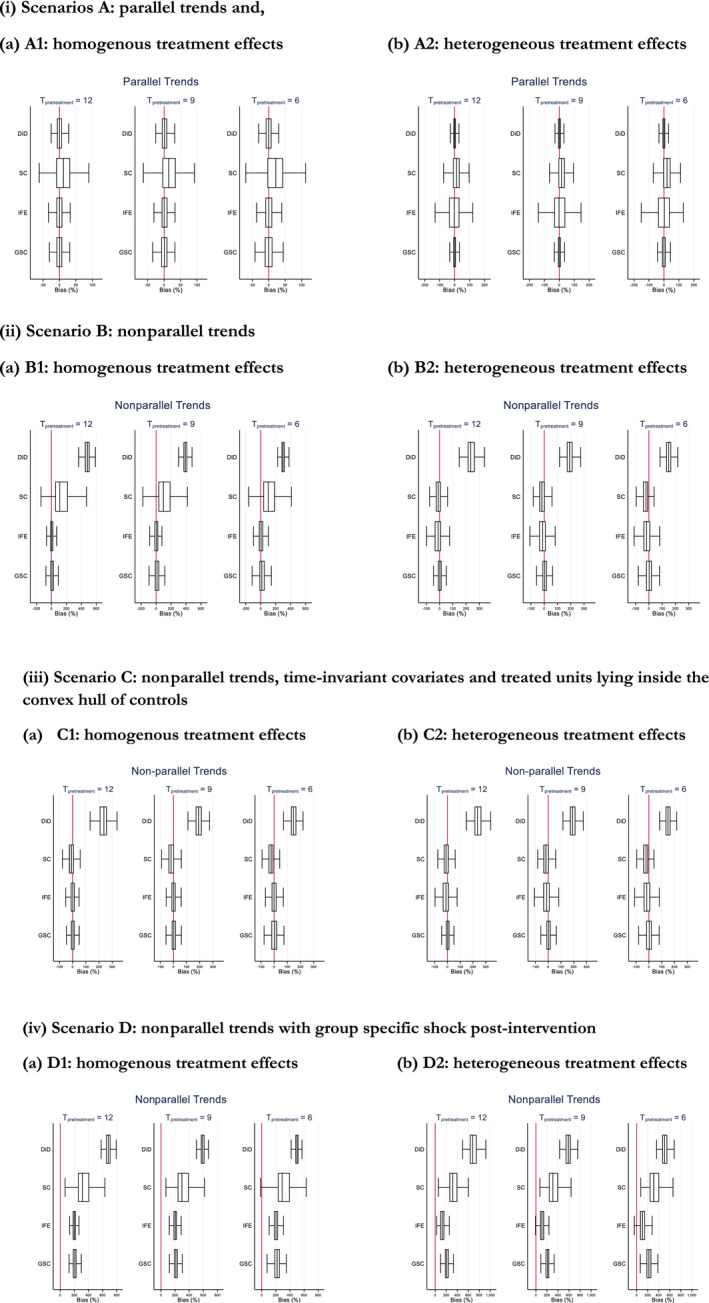
Figure 3.

Boxplot of mean % bias in treatment effect estimates from Monte Carlo simulation. (i) Scenarios A: parallel trends, (ii) Scenario B: non‐parallel trends, (iii) Scenario C: non‐parallel trends, time‐invariant covariates and treated units lying inside the convex hull of controls, (iv) Scenario D: non‐parallel trends with group specific shock post‐intervention. Note: 500 simulations. Tpretreatment is the number of pre‐treatment periods. Abbreviations: DiD, difference in differences; GSC, generalised synthetic control; IFE, interactive fixed effecs; SC= Synthetic control method [Color figure can be viewed at http://wileyonlinelibrary.com]
