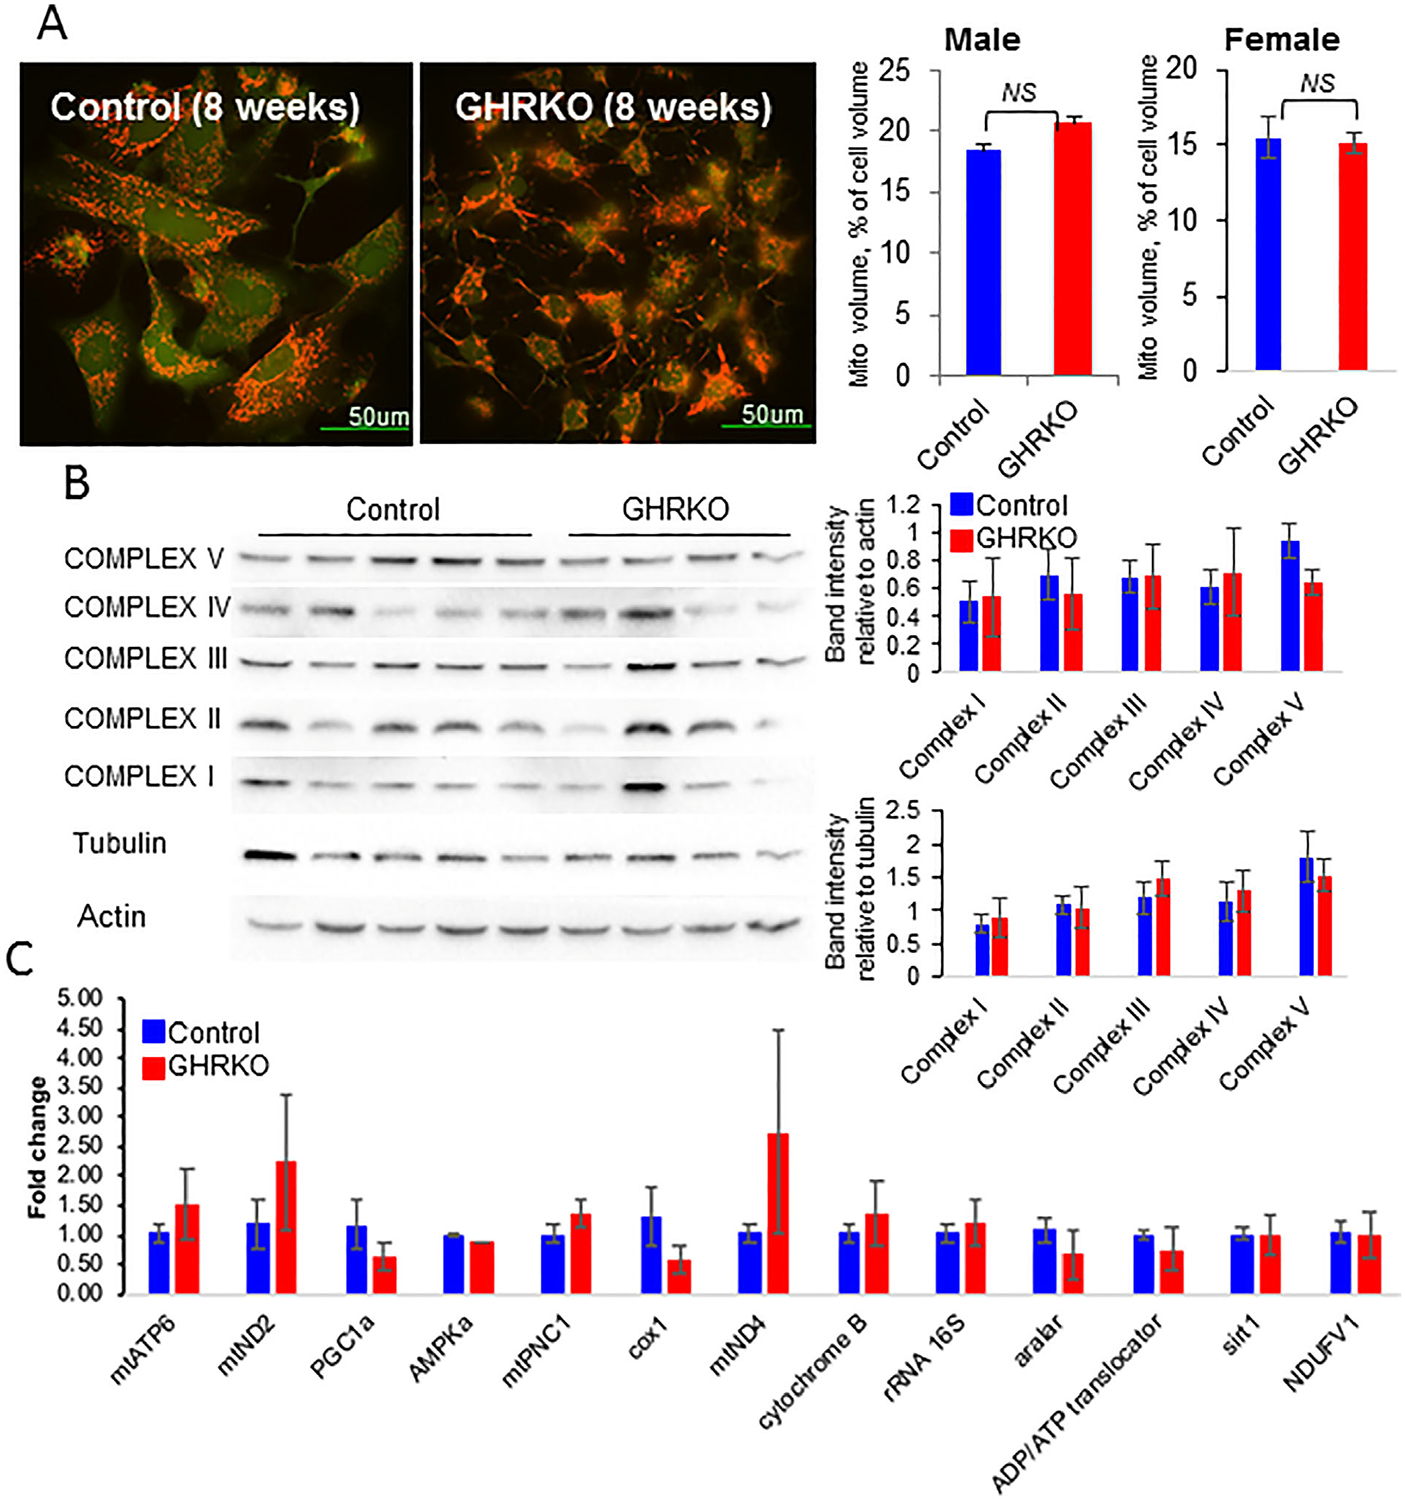
Fig. 3.

Mitochondria biogenesis in primary osteocyte cultures from control and GHRKO mice. (A) Primary osteocytes were seeded (0.4 × 10⁶ cells/mL) on collagen-coated glass plates and visualized using the 2000E Nikon Microscope Eclipse TE microscope at 60× magnification. Osteocyte mitochondrial volume/cell volume was determined from 3-dimensional images of z-stack volumes reconstructed using the Amira FEI software. Live cells were labeled with Calcein AM, and mitochondria were labeled with tetramethylrhodamine, ethyl ester (TMRE) (n = 20 cells/genotype/age). (B) Protein levels of electron transport chain complexes (I–V) were determined from cell lysates of primary osteocytes by Western immunoblotting using the Total OXPHOS cocktail. (C) Mitochondria-specific gene expression in primary osteocytes was determined using real-time polymerase chain reaction. Shown is a representative experiment with primary osteocyte cultures from 4-month-old control (n = 7) and GHRKO (n = 5) male mice. Data are presented as mean ± SEM, and significance was accepted at p < 0.05.
