
Fig. 5.
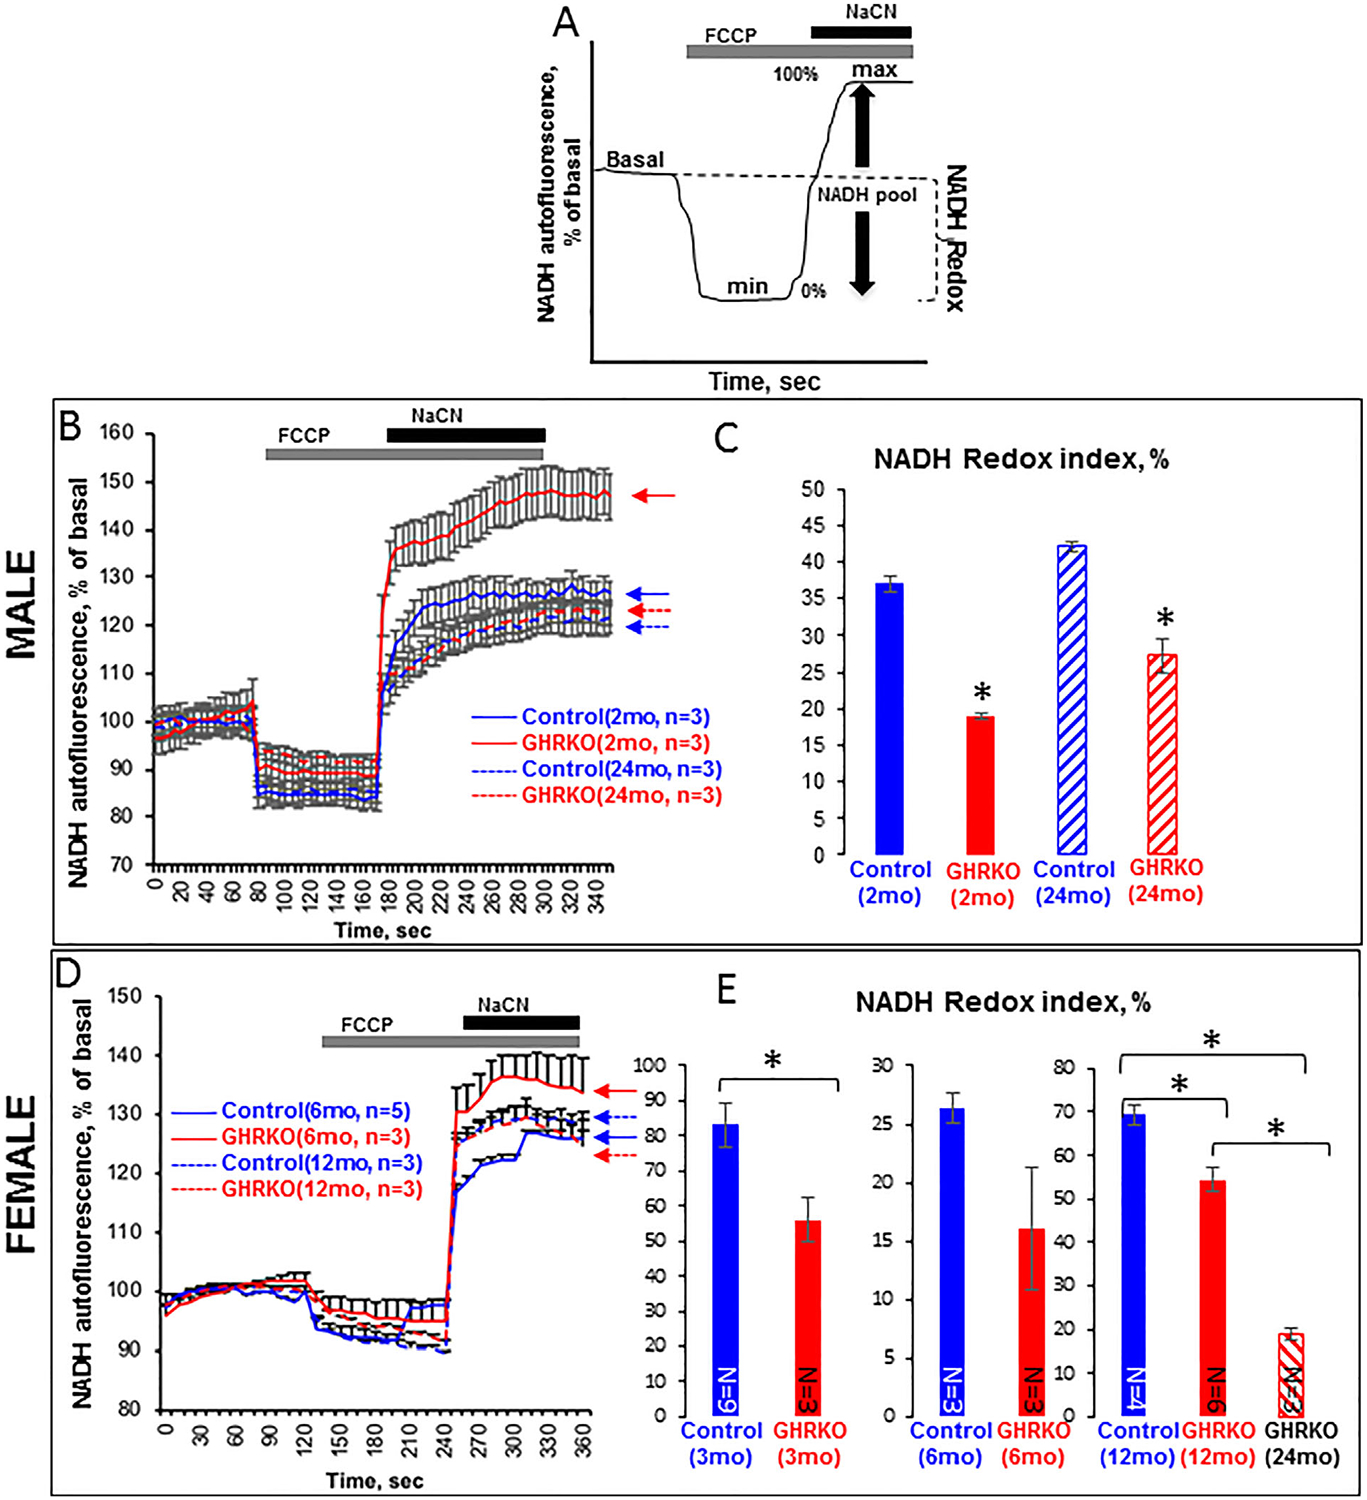
NADH redox state in primary osteocyte cultures from control and GHRKO mice. Cells were seeded (0.4 × 10⁶ cells/mL) on collagen-coated glass plates and visualized using the 2000E Nikon Microscope Eclipse TE microscope at 20× magnification. (A) Schematic representation of redox index calculations: basal level relative to maximal respiration after carbonyl cyanide 4-(trifluoromethoxy)phenylhydrazone (FCCP; 1 μM) (0%) and minimal respiration after NaCN (1 mM) (100%). (B) Time lapse of NADH autofluorescence in osteocytes from male mice, and (C) NADH redox index in osteocytes from male mice calculated according to (A). (D) Time lapse of NADH autofluorescence in osteocytes from female mice, and (E) NADH redox index in osteocytes from female mice calculated according to (A). Data are presented as mean ± SEM of 20 cells per time point.