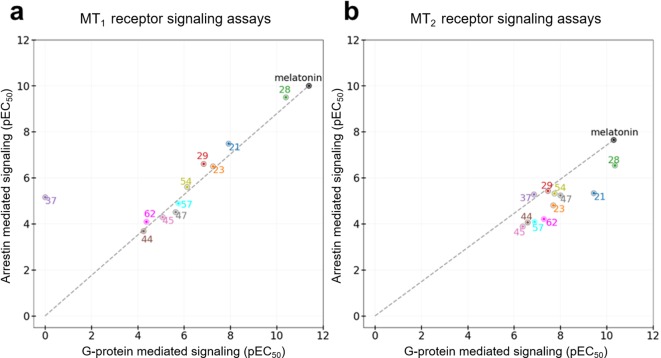
Figure 5. Functional selectivity of selected VLS hits at MT1 (a) and MT2 (b) receptors.
The pEC50 values of the ligands in G-Protein and Arrestin-mediated signaling assays are shown. The dashed lines for each receptor trace the melatonin datapoint to the origin, with compounds far above or below the line showing functional selectivity.

