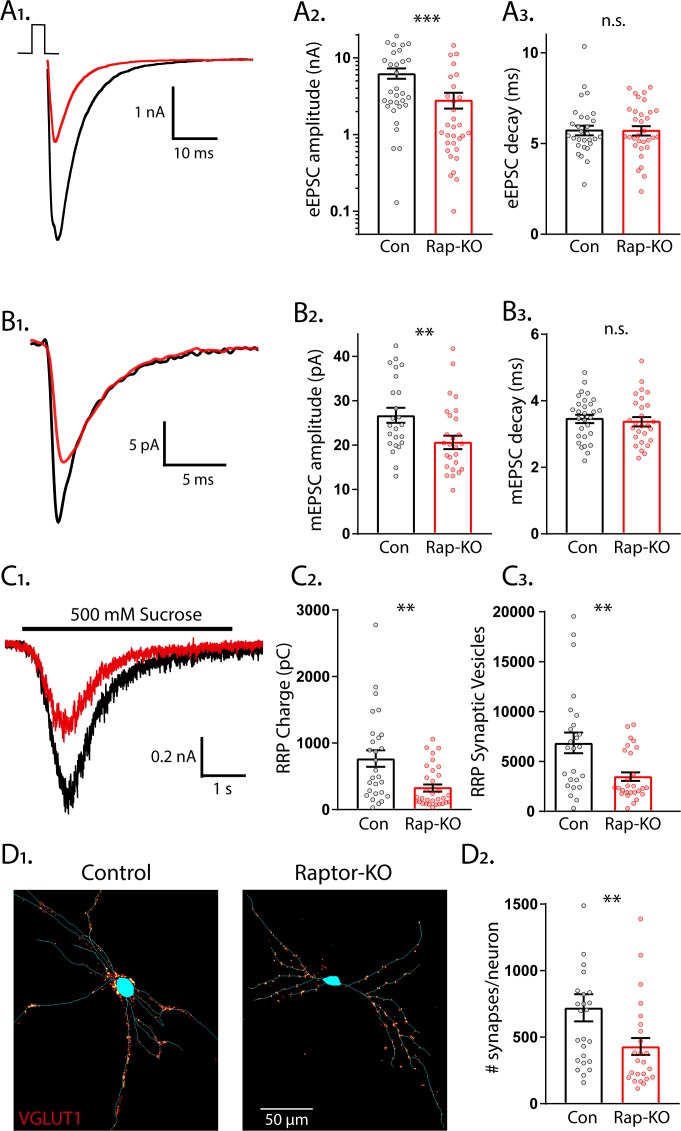
Figure 2. Loss of Raptor decreases the strength of evoked excitatory synaptic transmission via changes in quantal size and synapse number.
(A1) Example traces of evoked EPSCs (eEPSCs) recorded from single-neuron primary hippocampal cultures of Raptor-Con (black) and Raptor-KO (red) neurons. (A2) Plot showing the values of peak eEPSC amplitudes recorded from Raptor-Con (black) and Raptor-KO (red) neurons on a logarithmic scale. (A3) Plot showing the values of single exponential fits to the fast component of the eEPSC decay recorded from Raptor-Con (black) and Raptor-KO (red) neurons on a linear scale. (B1) Example traces of average miniature EPSCs (mEPSCs) recorded from single-neuron primary hippocampal cultures of Raptor-Con (black) and Raptor-KO (red) neurons. (B2) Plot showing the values of mEPSC peak amplitudes recorded from Raptor-Con (black) and Raptor-KO (red) neurons. (B3) Plot showing the distributions of mEPSC decay time constants recorded from Raptor-Con (black) and Raptor-KO (red) neurons. (C1) Example traces of the current response to 500 mM sucrose application recorded from single-neuron primary hippocampal cultures of Raptor-Con (black) and Raptor-KO (red) neurons. The black line indicates the time of sucrose application. (C2) Plot showing the values of the charge contained in the readily releasable pool (RRP) of Raptor-Con (black) and Raptor-KO (red) neurons, as determined by integrating the sucrose response after subtracting the steady state component. (C3) Plot showing the number of vesicles contained in the RRP of Raptor-Con (black) and Raptor-KO (red) neurons, as determined by dividing the RRP charge by the mean mEPSC charge for each neuron. (D1) Representative images showing fluorescence intensity in a red color look up table (LUT) from VGLUT1 immunostaining superimposed on a tracing of the cell body and dendrites from a Raptor-Con (left) and a Raptor-KO (right) neuron. (D2) Plot showing the values of synapse number per neuron for Raptor-Con (black) and Raptor-KO (red) neurons. For all dot plots, each dot represents the mean response from one neuron sampled from three independent cultures and the bars show the estimated marginal means and standard errors. ** indicates a p value of < 0.01, *** indicates p<0.001 and n.s. indicates p>0.05, as tested with Generalized Estimating Equations.

