. 2020 Mar 18;9:e49900. doi: 10.7554/eLife.49900

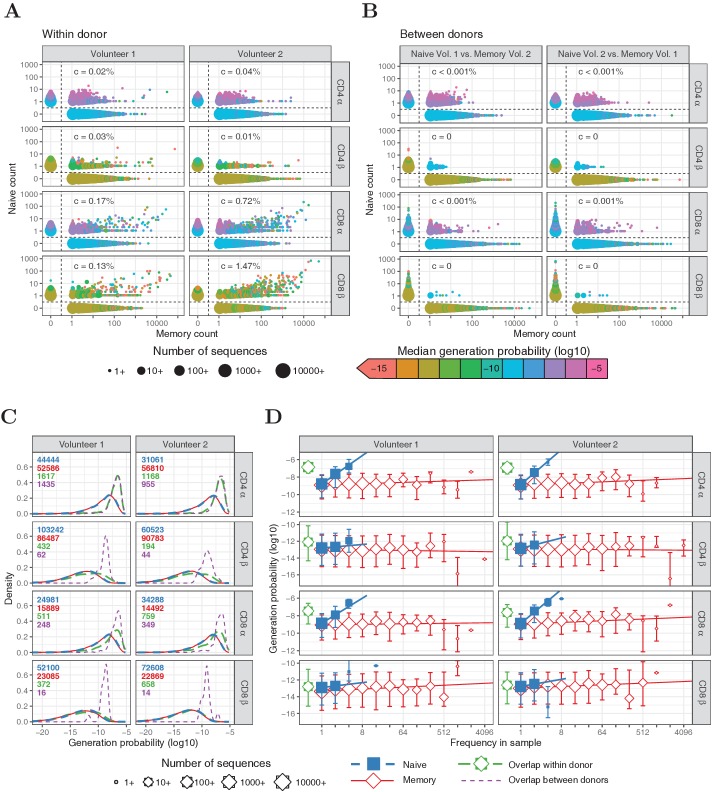
Figure 1. Frequencies and generation probabilities of TCRα and TCRβ sequences from memory and naive T cells.

(A) Frequency of TCRα and TCRβ sequences in naive versus total frequency in memory repertoires sampled from the same volunteer. Symbol sizes represent number of sequences with these frequencies and colour represents their median generation probability 𝒫(σ), as determined using IGoR (Marcou et al., 2018). The c value is the slope of linear regression on sequences with a memory count > 100 and indicates the estimated probability that a given TCR sequence from a memory cell appears in the naive sample. (B) As A., but comparing frequency in naive sample from one volunteer with frequency in memory from the other volunteer. (C) Distributions of generation probabilities (log10) for TCR α and β sequences from CD4+ and CD8+ from two volunteers. Blue dashed: naive, red solid: memory, green long-dashed: overlap (i.e., sequences observed in both naive and memory within a volunteer), purple dashed: overlap between volunteers (i.e., sequences observed in the naive subset of Volunteer 1 and a memory subset of Volunteer 2, or vice versa). The total number of sequences for each group are indicated in corresponding colors. (D) The median 𝒫(σ) is shown for each observed frequency class (log2 bins) of sequences exclusively observed in naive (blue squares) or memory T-cell (red diamonds) samples. 𝒫(σ) of the overlapping chains is shown in green for reference (irrespective of frequency). Symbol sizes indicate numbers of sequences for each frequency class. Error bars represent the 25% and 75% quartiles, solid lines indicate linear regression between observed frequency and 𝒫(σ), weighted by the number of sequences with that frequency.

Figure 1—source data 1. Memory and naive counts in Experiment 1.
Number of TCRα and TCRβ sequences exclusively occurring in naive or memory samples within log2-frequency bins, as in Figure 1D. Bin intervals are excluding the left, but including the right number.

Figure 1.

Figure 1—figure supplement 1. TCRα and TCRβ sequences abundant in naive tend to have less N-insertions.
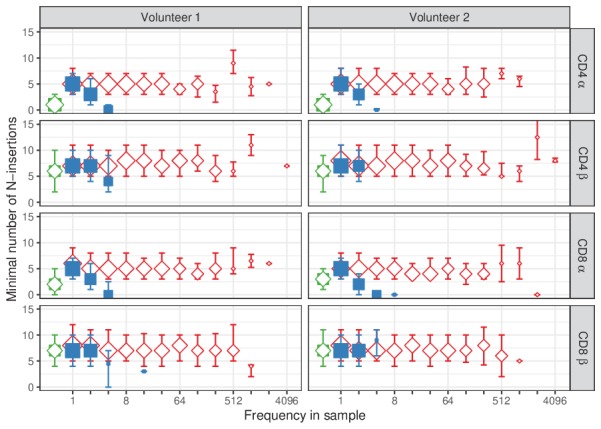
Figure 1—figure supplement 1.

For each sequence σ in our dataset of single samples, the minimal number of N-insertions was determined by the length of the CDR3 nucleotide sequence not matching germline TRAV and TRAJ (for TCRα), or TRBV, TRBD and TRBJ (for TCRβ). The median insertion length is shown for each observed frequency class (log2 bins) in naive (blue squares) and memory T-cell (red diamonds) samples. Insertion length of the overlapping TCR sequences is shown in green for reference (irrespective of frequency). Symbol sizes indicate numbers of sequences for each frequency class. Error bars represent the 25% and 75% quartiles.
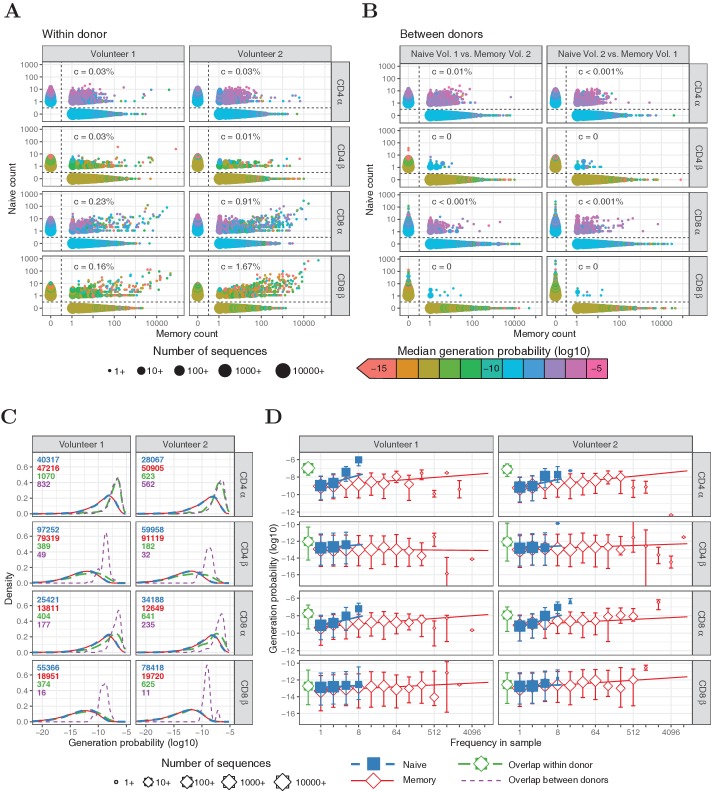
Figure 1—figure supplement 2. Similar to Figure 1, but for HTS data processed with RTCR.

Figure 1—figure supplement 2.

(A) Frequency in of TCRα and TCRβ sequences in naive versus total frequency in memory samples of the same volunteer. Symbol sizes represent number of sequences with these frequencies and their median generation probability (σ), as determined using IGoR (Marcou et al., 2018). The c value is the slope of linear regression on sequences with a memory count > 100 and indicates the estimated probability that a given TCR sequence from a memory cell is FACS-sorted as naive. (B) As A., but comparing frequency in naive sample from one volunteer with frequency in memory from the other volunteer. (C) Distributions of generation probabilities (log10) for TCR α and β sequences from CD4+ and CD8+ from two volunteers. Blue dashed: naive, red solid: memory, green long-dashed: overlap (i.e., sequences observed in both naive and memory within a volunteer), purple dashed: overlap between volunteers (i.e., sequences observed in the naive subset of Volunteer one and a memory subset of Volunteer 2, or vice versa). The total number of sequences for each group are indicated in corresponding colors. (D) The median (σ) is shown for each observed frequency class (log2 bins) of sequences exclusively observed in naive (blue squares) or memory T-cell (red diamonds) samples. (σ) of the overlapping chains is shown in green for reference (irrespective of frequency). Symbol sizes indicate numbers of sequences for each frequency class. Error bars represent the 25% and 75% quartiles, solid lines indicate linear regression between observed frequency and (σ), weighted by the number of sequences with that frequency.