. 2020 Mar 18;9:e49900. doi: 10.7554/eLife.49900

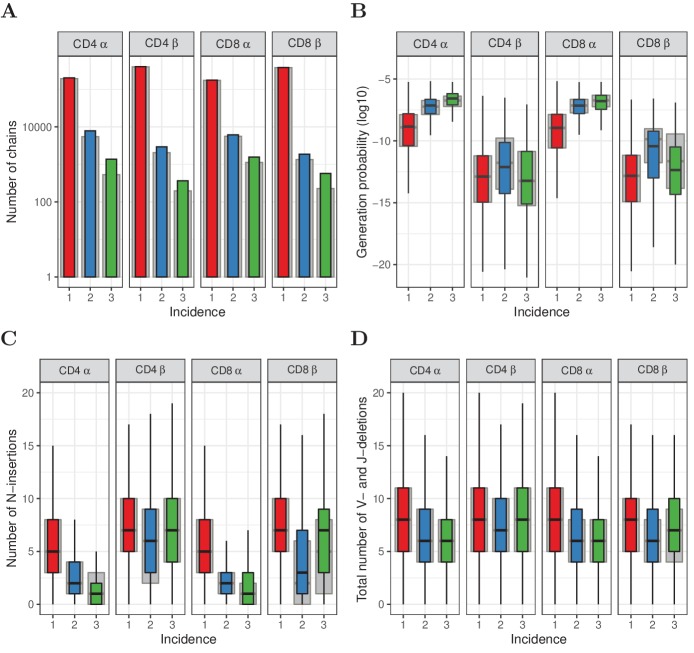
Figure 2. Subsampling naive T cells confirms that frequently observed TCRα but not TCRβ sequences have high generation probabilities.

(A) The number of TCRα and TCRβ sequences observed in 1, 2 or 3 subsamples (experiment 2). The grey background bars show the results after removing all sequences that were also observed in the corresponding memory samples. (B) Generation probabilities 𝒫(σ) (log10) of TCRα and TCRβ sequences observed in 1, 2 or 3 subsamples. (C) Minimal number of N-additions of TCRα and TCRβ sequences observed in 1, 2 or 3 subsamples. (D) Number of V- and J-deletions of TCRα and TCRβ sequences observed in 1, 2 or 3 subsamples. The plot shows median (black horizontal line), interquartile range (filled bar) and the range from the bar up to 1.5 times the interquartile range (black vertical range, outliers not shown).

Figure 2—source data 1. Naive TCRα and TCRβ abundance in the subsamples of Experiment 2.
Per dataset, the number of TCR sequences is shown per incidence and abundance across subsamples. Abundance is log2 binned according to the total UMI count across the three naive subsamples. Pearson correlation coefficient between incidence and total UMI count is shown for each dataset.

Figure 2.

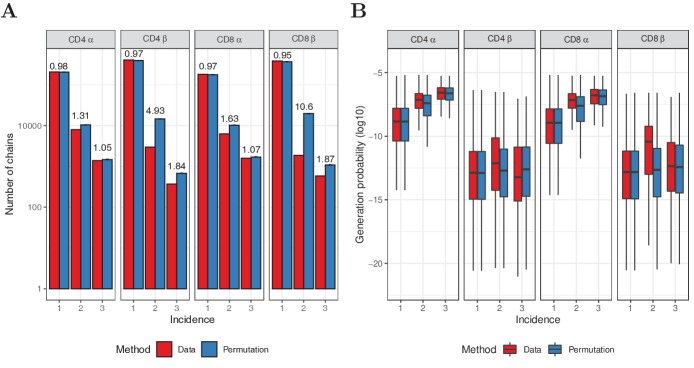
Figure 2—figure supplement 1. Permutation of subsampling experiment.

Figure 2—figure supplement 1.

(A) Number of chains observed in 1, 2 or 3 subsamples (red) and after redistributing the sequences over the samples (blue). For the permutation test, mean values of 10 iterations are shown, with error bars indicating one standard deviation. The fold-change between data and permutation is indicated on top of the bars. (B) Generation probabilities of the sequences in A, as determined with IGoR (Marcou et al., 2018). The plot shows median (black horizontal line), interquartile range (filled bar) and the range from the bar up to 1.5 times the interquartile range (black vertical range, outliers not shown).
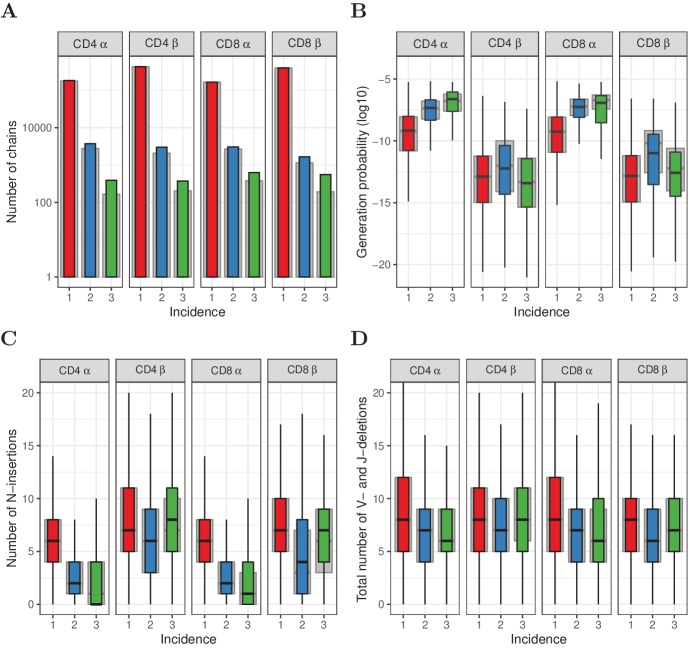
Figure 2—figure supplement 2. Similar to Figure 2, but for HTS data processed with RTCR.

Figure 2—figure supplement 2.

(A) The number of TCRα and TCRβ sequences observed in 1, 2 or 3 subsamples. The grey background bars show the results after removing all sequences that were also observed in the corresponding memory samples. (B) Generation probabilities (σ) (log10) of TCRα and TCRβ sequences observed in 1, 2 or 3 subsamples. (C) Minimal number of N-additions of TCRα and TCRβ sequences observed in 1, 2 or 3 subsamples. (D) Number of V- and J-deletions of TCRα and TCRβ sequences observed in 1, 2 or 3 subsamples. The plot shows median (black horizontal line), interquartile range (filled bar) and the range from the bar up to 1.5 times the interquartile range (black vertical range, outliers not shown).
Figure 2—figure supplement 3. Observed frequency predicts sharing for TCRα but not TCRβ sequences.
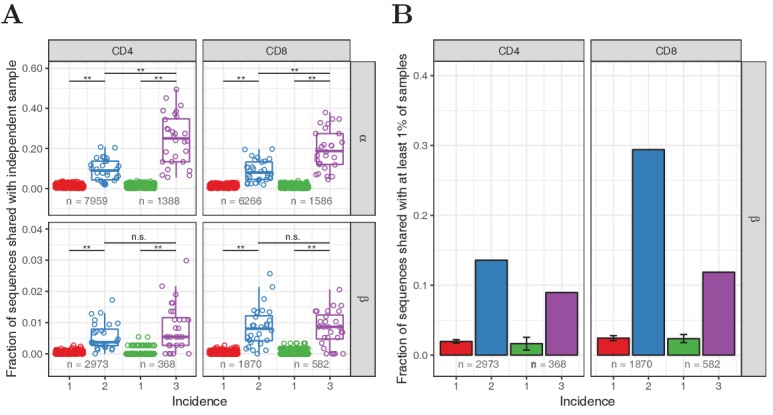
Figure 2—figure supplement 3.

(A) We compared the occurrence of TCRα and TCRβ sequences observed in two or three subsamples (incidence 2 or 3, respectively), and equalsize samples of sequences observed in one subsample (incidence 1), in unfractionated blood samples collected from 28 healthy donors. Symbols depict the number of shared TCRα or TCRβ sequences for each whole blood repertoire, as a proportion of the total number in the samples being tested (the latter is indicated at the bottom). The boxplot depicts the median value and 25th and 75th percentiles. Shared fractions were compared by Wilcoxon-Mann-Whitney test, **: p<0.01, n.s.: not significant (p>0.05). (B) Fraction of each set of sequences from A that was observed in at least 1% of the samples from a large cohort of 786 individuals (Emerson et al., 2017). Error bars show the standard deviation for the multiple sets of sequences with incidence 1. A smaller fraction of the most frequently observed β chains (incidence 3) are shared than those with incidence 2, which is in line with the (σ) observations using IGoR.