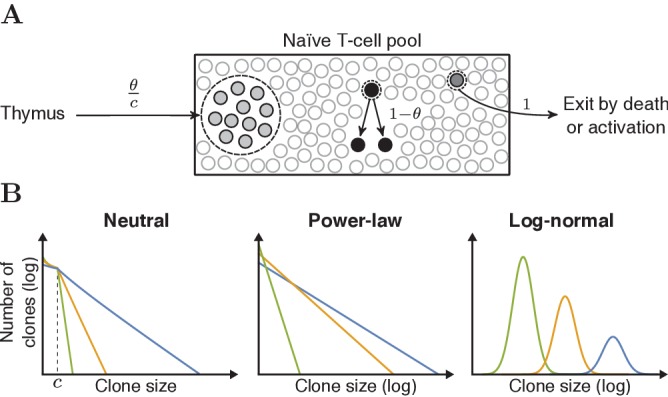
Figure 3. Schematic representation of the neutral model and various clone-size distributions.

(A) Schematic representation of the dynamics of the neutral model for the naive T-cell pool. Each event starts with removal of one randomly selected cell from the pool, followed by peripheral division of another cell (with probability 1- θ), or a chance for thymic production (probability θ). After of these thymus events, a clone of cells is generated and added to the peripheral pool, reflecting the divisions of T cells before entering the periphery. (B) Schematic representations of the various clone-size distributions that were used to predict the naive repertoire. The green, orange and blue colored lines depict three parameter choices for each distribution, resulting in a low, medium and high mean clone size, respectively.
