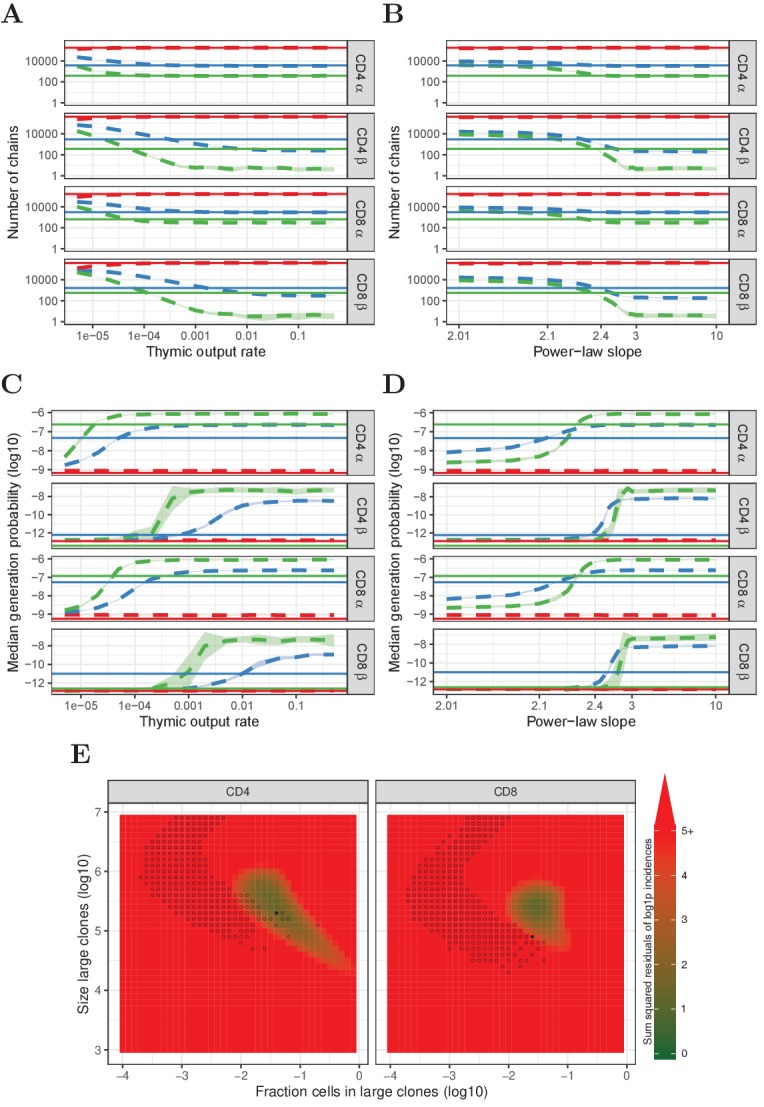
Figure 4. Predictions of the neutral, power-law and two-population model compared with HTS data.
(A) Number of TCRα and TCRβ sequences which are predicted to be shared between 1 (red), 2 (blue) and 3 (green) subsamples as a function of the thymic output rate θ for the neutral model. (B) As A., but as a function of the slope of the power-law distribution. (C) The median generation probability of TCRα and TCRβ sequences predicted by the neutral model. Dashed lines depict the mean of 10 model prediction repeats, shaded area indicates the standard deviation, solid lines show observed results in HTS data. (D) As C., but as a function of the slope of the power-law distribution. (E) Graphical representation of parameter sweep results for prediction of CD4+ and CD8+ repertoires from αβ clone-size distributions following a mixture model consisting of singleton clones and a small fraction of large clones. The color represents goodness of fit, with dark green being better predictions for number of sequences per incidence in samples. Empty circles indicate parameter combinations resulting in qualitatively correctly predicted , that is 3 > 2 > 1 for TCRα and 2 > 1 for TCRβ and 2 > 3 for TCRβ. Filled circles indicate parameter combinations with the smallest distance to the incidence data and a correct prediction.
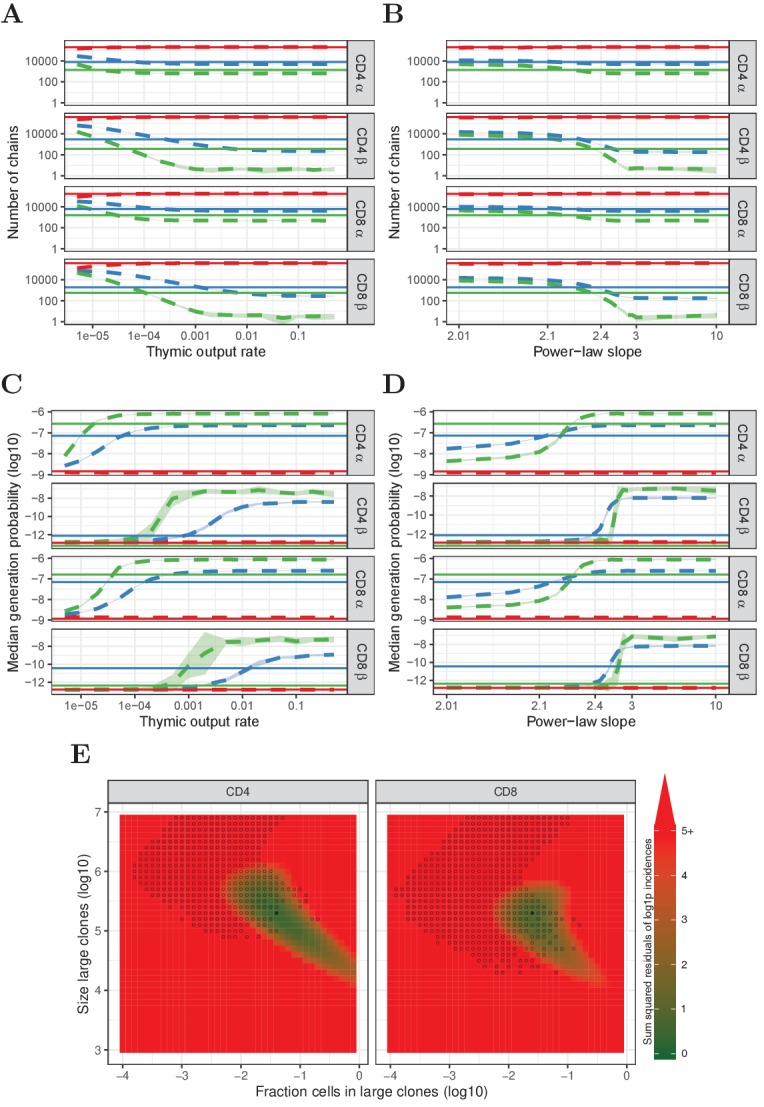
Figure 4—figure supplement 1. Prediction of power-law model (exponent 2.3) for single sample data.
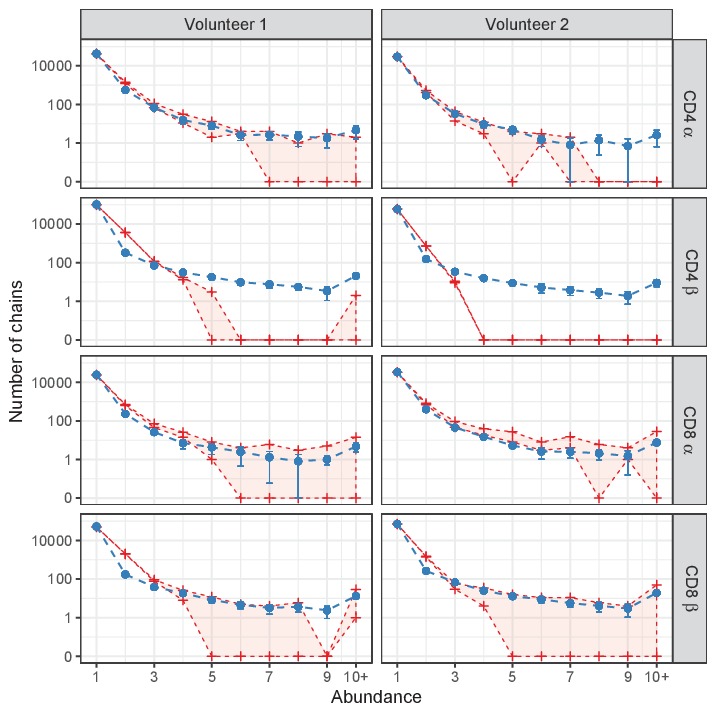
Figure 4—figure supplement 2. Similar to Figure 4, but for HTS data from which TCRα and TCRβ sequences were removed that also occurred in the corresponding memory samples.
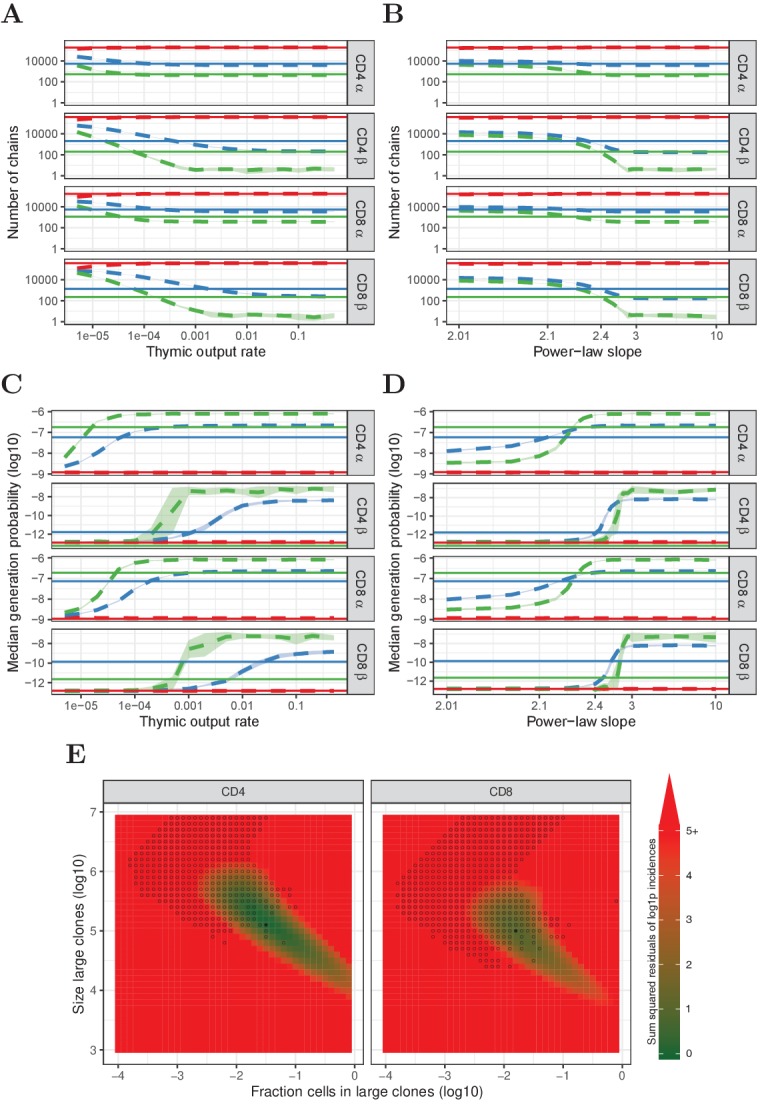
Figure 4—figure supplement 3. Similar to Figure 4, but for HTS data processed with RTCR.