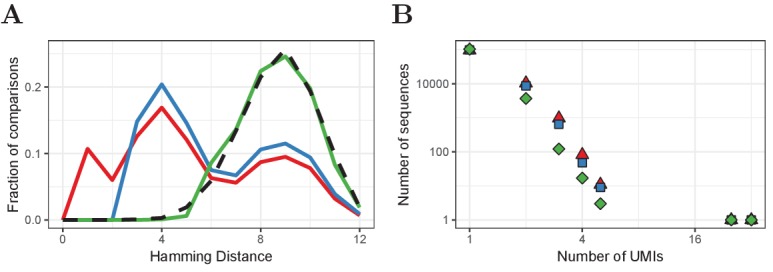
Figure 6. Improved UMI correction leads to more reliable estimation of sequence frequencies.

(A) Distribution of Hamming Distances of UMIs within TCRβ sequences (naive CD4+ sample of volunteer 1) before correction (red), after default correction (blue) and after improved correction (green), in comparison with the distribution of UMIs between sequences (black dashed). (B) Distributions of the same TCRβ sequences after the different correction strategies. Frequently observed TCRβ sequences remain at the same frequency after correction, whereas the frequency of other sequences tends to be overestimated due to mutated UMIs, which is compensated for by improved UMI correction.
