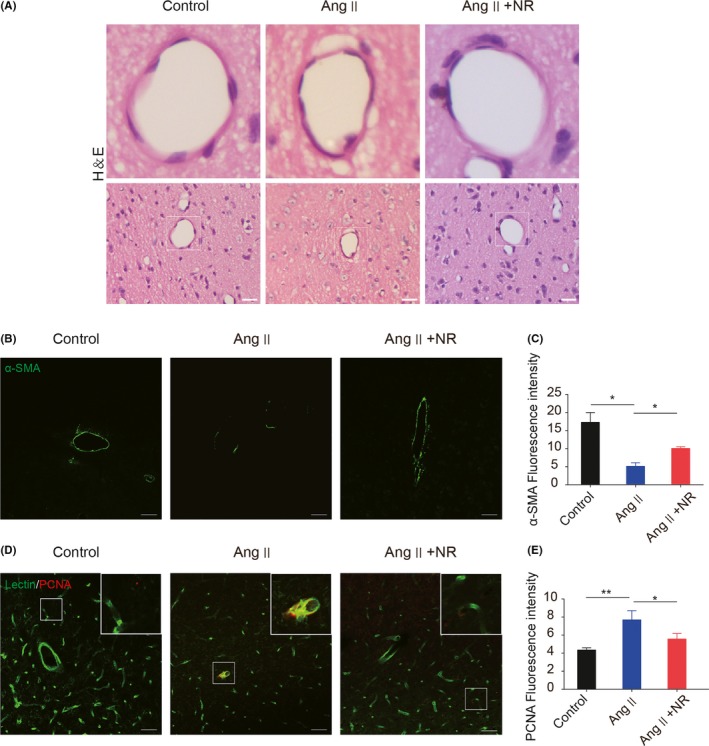
Figure 3.

NR administration reduces the angiotensin ‐–induced phenotypic transformation of smooth muscle cells. (A) Representative images of arterioles stained with H&E in control, Ang ‐–treated, and NR‐treated mice after 28 d. (B‐C) Representative immunofluorescence images and the quantification analysis of α‐SMA in the 3 groups. (D‐E) Representative immunofluorescence images and the quantification analysis of PCNA in the 3 groups after staining with lectin. Scale bars: A = 100 μmol/L, B and D = 50 μm; *P < .05, **P < .01. Ang: angiotensin ‐, Ang + NR: angiotensin ‐+nicotinamide riboside. The results are presented as the means ± standard deviations (SDs)
