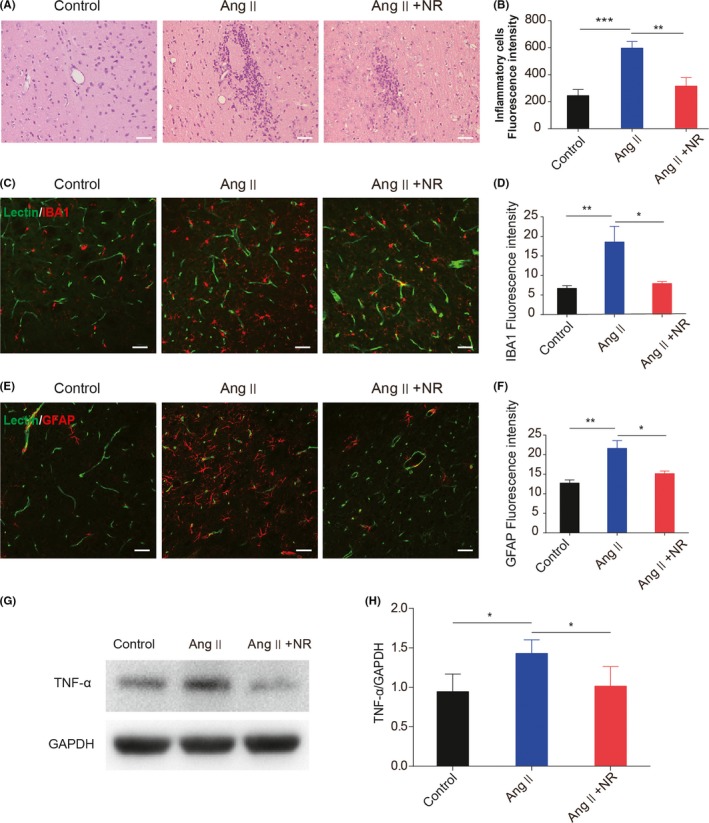
Figure 4.

NR administration suppresses the angiotensin ‐–induced excessive activation of microglia and astrocytes. (A‐B) Representative images of inflammatory cells in the brains of control, Ang ‐–treated, and NR‐treated mice after 28 d. (C‐F) Representative immunofluorescence images and the quantification of IBA1 and GFAP after staining with lectin in control, Ang II–treated, and NR‐treated mice. (G‐H) Immunoblotting analysis and the quantification of TNF‐α in the 3 groups. Scale bars A = 100 μmol/L, C and E = 50 μm; *P < .05, **P < .01, ***P < .001. Ang: angiotensin ‐, Ang + NR: angiotensin ‐+nicotinamide riboside. The results are presented as the means ± standard deviations (SDs)
