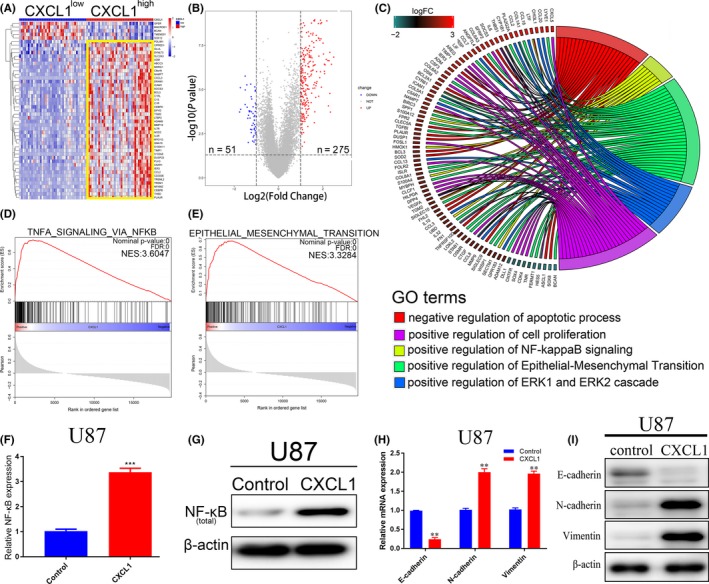
Figure 5.

CXCL1 induced radioresistance in GBM via regulation of NF‐κB signaling and mesenchymal transition. A, Hierarchical bi‐clustering analysis was performed by using TCGA GBM database, indicating the significant gene signature in CXCL1high GBM compared with CXCL1low GBM. B, The amount of differentially expressed genes in CXCL1high and CXCL1low groups was presented by volcano plot (log2FC > 1 or log2FC<−1, with an adjusted P value < .05). C, Gene ontology (GO) analysis for differentially expressed genes. (CXCL1high vs CXCL1low).D and E, Gene set enrichment analysis (GSEA) was performed to find out the highly enriched signaling pathways in CXCL1high group. F, mRNA expression of NF‐κB was measured by qRT‐PCR analysis (***P < .001, with t test). G, Western blot of total NF‐κB/p65 expression, β‐actin was used as a loading control. H, mRNA expression of mesenchymal transition markers was measured by qRT‐PCR analysis (**P < .05, with one‐way ANOVA followed by Dunnett's post‐test). I, Western blot of mesenchymal transition markers. β‐actin was used as a loading control
