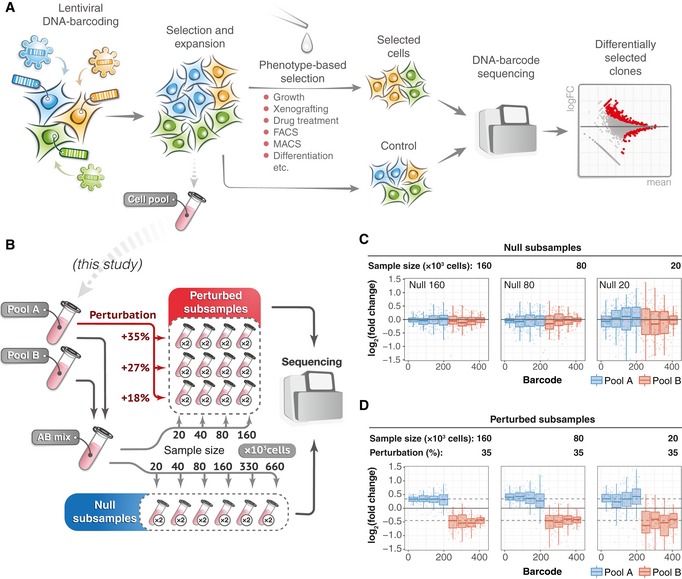
To generate the benchmark barcode count datasets, we performed two independent high‐complexity DNA barcoding experiments on Mia‐PaCa‐II and OVCAR5 cell lines (see
Materials and Methods for details). In each experiment, cells were collected after selection and expansion step (Fig
1A) to produce two cell pools (Pool A and Pool B). Cells in each pool were counted and mixed in a 50/50 ratio to produce “AB mix”. The AB mix was then sampled in various extents in two replicas to produce so‐called null samples with different numbers of cells (20 × 10
3, 40 × 10
3, 80 × 10
3, 160 × 10
3, 330 × 10
3, 660 × 10
3), but with the same expected representation of each barcode. Perturbed samples were generated by taking either 20, 40, 80 or 160 thousand cells from the AB mix, and adding an indicated percentages of cells from the Pool A (e.g. for sample with 160 × 10
3 cells and perturbation degree of 35%, we added 160 × 10
3 × 0.35 = 56 × 10
3 cells from the Pool A). The number of replicas for each sample is indicated in circles next to the tube icon.

