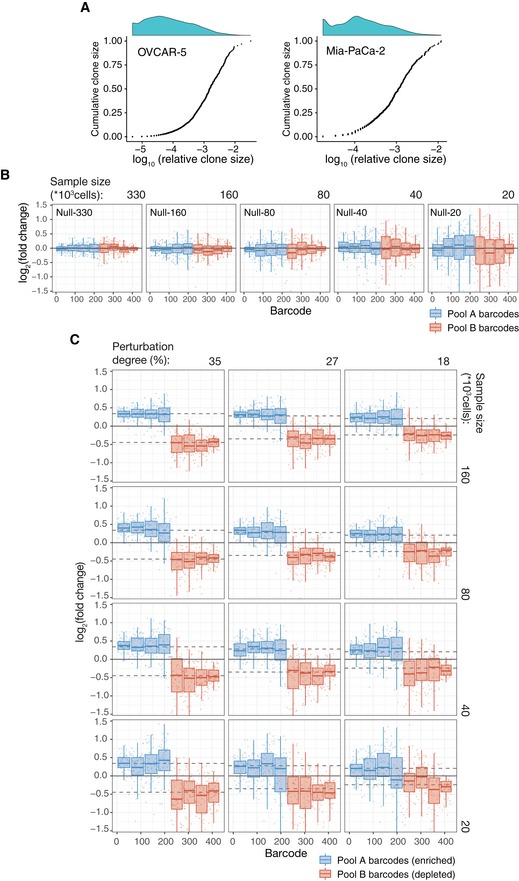
Figure EV1. Clone size characteristics of the benchmark datasets.

- Cumulative distributions of clone sizes in OVCAR‐5 null‐660 sample (left) and Mia‐Paca‐2 null‐40 sample (right).
- Barcode representation fold changes (log2) for the null samples of the indicated sizes (number of cells subsampled from the AB mix) relative to the mean of two Null‐660 replicas. Barcodes are ordered according to the size in the Null‐660 subsamples. Pool A barcodes are sorted in the descending order, and Pool B barcodes are ordered in the ascending order. Boxes represent interquartile ranges (25 to 75 percentile) for each group of 53 observations. Whiskers indicate upper and lower quartiles. Central line corresponds to the median value.
- Same as Fig EV1B but for the perturbed subsamples. Dotted lines indicates the expected barcode fold changes calculated using formula: (cells from pool A/total number of cells)/0.5, for the Pool A barcodes, and formula: (cells from pool B/total number of cells)/0.5, for the Pool B barcodes. Data representation is the same as in (B).
