
Figure EV2. Sampling size affects statistical properties and accuracy of DRB calling.
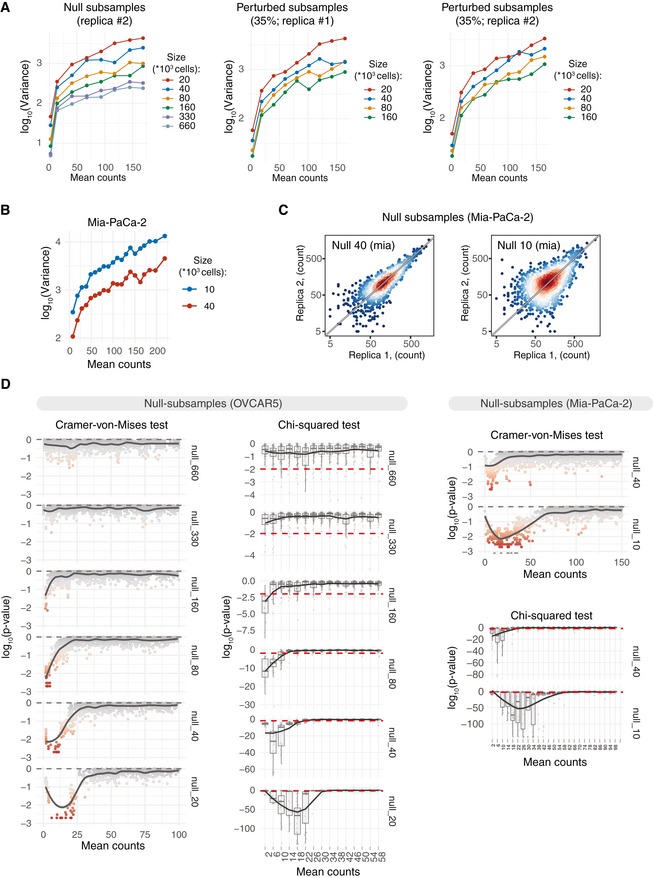
- Mean–variance plots for the benchmark OVCAR5 null subsamples (replica#2) and perturbed subsamples (35% perturbation degree; replicas #1 and #2). Local variance was calculated by averaging a tagwise variance over the mean counts using a 20 read‐count window. Mean counts were estimated using all the null or perturbed samples, respectively.
- Mean–variance plots for Mia‐PaCa‐2 null subsamples. Barcode read counts were median‐normalized. Local variance was calculated by averaging a tagwise variance over the mean counts using a 20 read‐count window.
- Scatter plots of median‐normalized read counts of Mia‐PaCa‐2 null subsamples.
- Local negative binomial goodness of fit was estimated using chi‐squared test or Cramer–von Mises test. Dispersion parameter of the negative binomial model was estimated locally over the window of 3 read counts using maximum‐likelihood estimator. P‐value of the chi‐squared test statistics was estimated using fitdistrplus::gofstat() function. P‐values of the Cramer–von Mises test were calculated by Monte Carlo bootstrap method as implemented in RVAideMemoire::cramer.test.