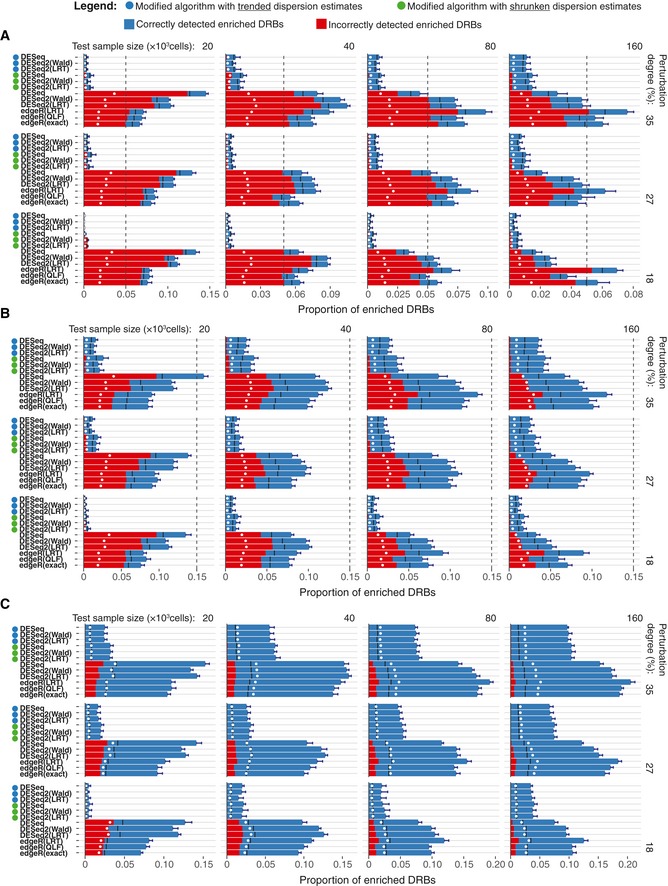
Figure EV3. Comparison of the algorithm’ performance on the perturbed subsamples.

-
A–CCircles left to the algorithms’ names indicate the modified algorithms. Two replicas of the perturbed subsamples of indicated sample size (top), perturbation degree (right) and enriched barcode ratios of 0.05 (A), 0.15 (B) and 0.5 (C) were tested for DRBs against four control samples (two Null‐660 samples and two Null‐330 samples). Bars represent the average proportion of DRBs classified as enriched (fold change > 0) under the FDR threshold of 0.25, calculated over threefold bootstrap runs (10 resamples with replacement). Red bars indicate the average fraction of false positives (incorrectly assigned to the enriched group). Black lines indicate the “random” FDR—the average fraction of false discoveries observed when P‐values were randomly permuted over the barcodes. White points indicate the nominal FDR threshold of 0.25. Dashed vertical lines indicate the total proportion of enriched barcodes. Error bars, SD.
