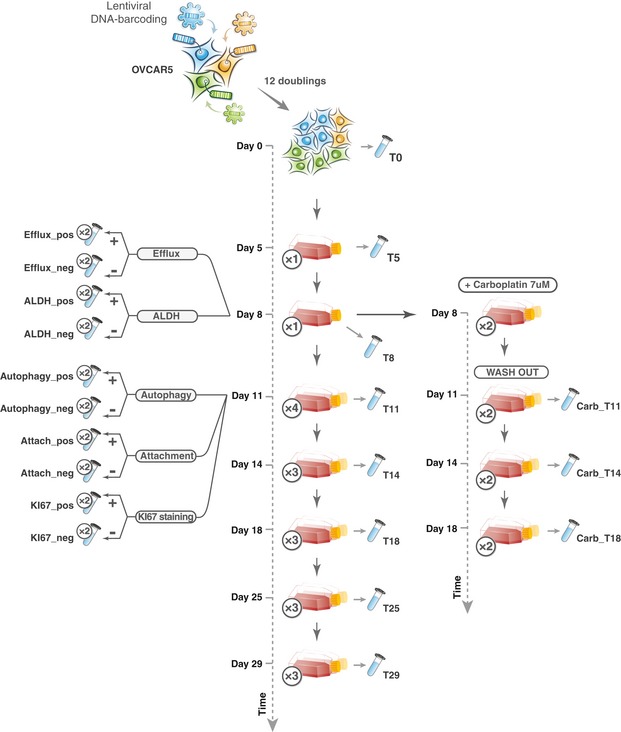
Figure EV5. A schematic representation of OVCAR5 clonal phenotypic profiling experiment.

In the proliferation assay, 3 million cells were plated in each passage, and at day 8, the population was split into 4 replicas. The tube image indicates that the sample was collected for sequencing. Sample name as used in the read count table (Dataset EV4) is marked next to the tube images. The number of replicas is indicated in the circles next to the flask/tube icons.
