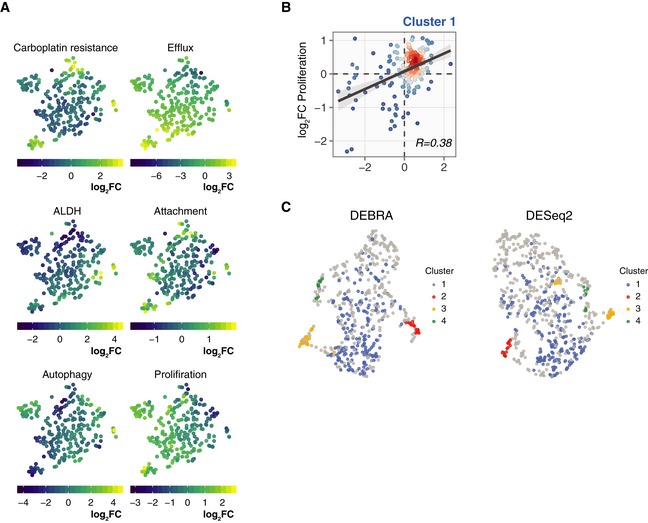
Figure EV6. Barcode fraction fold changes for OVCAR5 single‐clone phenotypes.

- t‐SNE projections of the OVCAR5 clonal phenotypic profiles. The clones are colour‐coded according to the manifestation of the phenotype, calculated as log2 ratio of barcode counts between (1) positively and negatively selected populations after ALDH, attachment, efflux capacity or autophagy assays; (2) treated and untreated samples (T14) for carboplatin treatment assay; or (3) day 8 and day 1 time points for proliferation assay.
- Scatter plot of barcode fraction fold changes in OVCAR5 cells in response to carboplatin treatment and after 7 days of growth assay for cluster 1 (Bulk; see Fig 5F).
- UMAP projections of the OVCAR5 clonal phenotypic profiles for clones selected according to the FDR level as determined by the DEBRA (left) or DESeq2 (right). The barcode was selected for the analysis if the minimum FDR value from the carboplatin, ALDH and efflux assays was less than 0.1. The clones are colour‐coded according to clusters as defined at Fig 5F.
