
Figure 2.
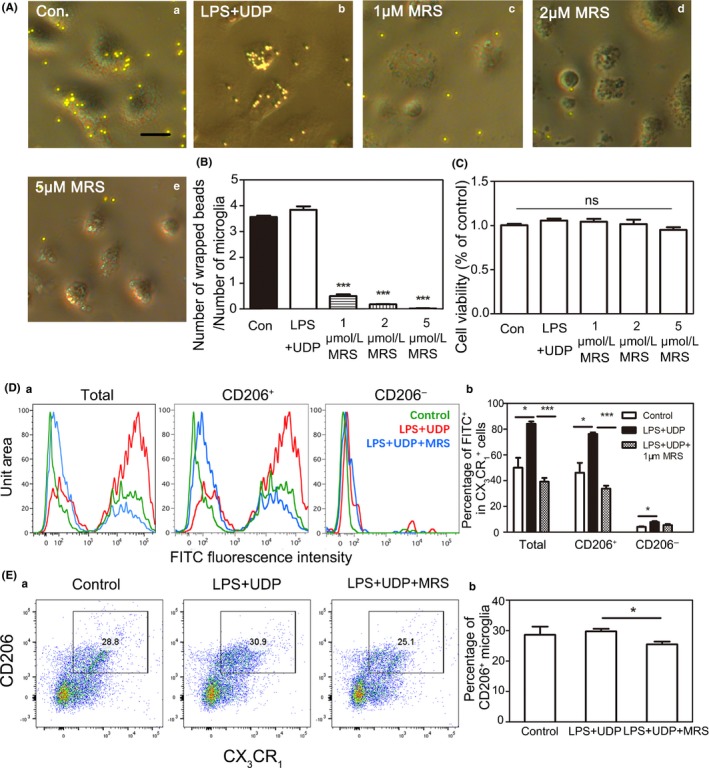
P2Y6 receptor‐specific inhibitor MRS2578 blocked the phagocytosis of primary microglia under LPS & UDP stimulation. A, Representative images of fluorescent latex beads (yellow) phagocytized by primary microglia under 12 h LPS (200 ng/mL) & UDP (100 μmol/L) stimulation in the control, LPS+UDP, 1 μmol/L MRS, 2 μmol/L MRS, and 5 μmol/L MRS group. (a) Control group, only cultured by basic culture medium of microglia, (b) MRS2578‐free group, 200 ng/mL LPS, and 100 μmol/L UDP in basic culture medium of microglia, (c) 1 μmol/L MRS2578 group, 200 ng/mL LPS, 100 μmol/L UDP, and 1 μmol/L MRS2578 in basic culture medium of microglia, (d) 2 μmol/L MRS2578 group, 200 ng/mL LPS, 100 μmol/L UDP, and 2 μmol/L MRS2578 in basic culture medium of microglia, (e) 5 μmol/L MRS2578 group, 200 ng/mL LPS, 100 μmol/L UDP, and 5 μmol/L MRS2578 in basic culture medium of microglia. Scale bar = 10 μm. B, Quantification for the number of beads per microglia under LPS (200 ng/mL) & UDP (100 μmol/L) stimulation (n = 3 per group). C, CCK‐8 assay in primary microglia without or with different concentrations MRS2578 under LPS+UDP stimulation for 12 h. D, (a) Representative flow cytometry analysis of microglia phagocytosis. Phagocytosis of fluorescein isothiocyanate (FITC)‐labeled latex beads by CD206+ and CD206‐ microglia. (Green, untreated control; Red, LPS+UDP treatment; Blue: LPS+UDP+1 μmol/L MRS2578 treatment); (b) Percentage of FITC+ cells in CX3CR1 + cells for total, CD206+, and CD206‐ microglia. E, (a) Representative diagrams of CD206+/CX3CR1 + cells in the control, LPS+UDP, LPS+UDP+MRS2578 group, (b) Percentage of CD206+/CX3CR1 + in the control, LPS+UDP, LPS+UDP+MRS2578 group. Data were presented as mean ± SEM. n = 3 per group. *P < .05, **P < .01, ***P < .001