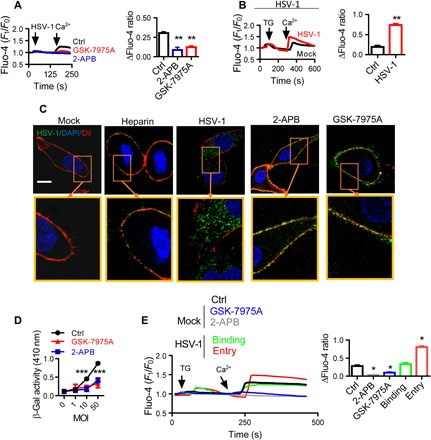
Fig. 1. SOCE is activated during HSV-1 infection of HEp-2 cells.

(A) HSV-1 infection elicits SOCE. Fluo-4–loaded HEp-2 cells were infected with 0.5 MOI of HSV-1 in the absence of extracellular Ca2+ (first arrow) and then treated with 50 μM 2-APB or 10 μM GSK-7975A before Ca2+ was added back (second arrow). Traces show relative fluorescence intensity. Bar graph to the right shows statistical analysis of peak fluorescence increase due to Ca2+ influx over the resting levels. For each condition, data were obtained from three replications, each of which included 10 cells, meaning a total of 30 cells per condition [same for (B), (C), and (E)]. (B) SOCE is increased in HSV-1–infected cells. HEp-2 cells were infected with HSV-1 at 0.5 MOI for 15 min and then treated with TG (left arrow). Ca2+ was then returned to the cells (right arrow). (C and D) SOCE modulates HSV-1 entry. HEp-2 cells were treated with 50 μM 2-APB or 10 μM GSK-7975A and then infected with HSV-1. (C) Representative immunofluorescence images showing the entry of HSV-1. DiI (red) indicates the PM; soluble heparin (10 μg/ml) was used to block binding as an additional negative control. Scale bar, 10 μm. DAPI, 4′,6-diamidino-2-phenylindole. (D) Viral entry analyzed with β-Gal assays. (E) HSV-1 entry is associated with SOCE modulation. SOCE was analyzed during HSV-1 binding or entry into HEp-2 cells as described in (B). Alternatively, uninfected cells were treated with 2-APB or GSK-7975A as negative controls. *P < 0.05, **P < 0.01, and ***P < 0.001 by unpaired t test (B), one-way analysis of variance (ANOVA) (A and E), and two-way ANOVA (D). Graphs show the mean ± SD.
