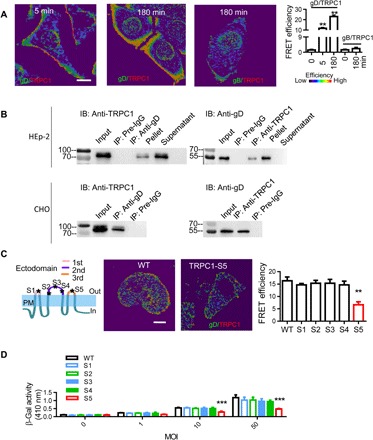
Fig. 3. Interaction between TRPC1 and HSV-1 gD.

(A) Representative images and statistics of interaction between TRPC1 and gD. Colocalization of TRPC1 with gD or gB was analyzed by FRET at different time points of infection. For each condition, data were obtained from three replications, each of which included 5 cells, meaning a total of 15 cells per condition [same for (C)]. (B) TRPC1 coimmunoprecipitates with gD. HEp-2 cells (upper panels) or TRPV1-OE–transfected CHO cells (lower panels) were infected with HSV-1, and the interaction between TRPC1 and HSV-1 gD was analyzed by coimmunoprecipitation. Preimmune IgG served as a control. A converse coimmunoprecipitation was also performed for each treatment. Input was from the whole-cell extract as a positive control; supernatant and pellet were obtained after immunoprecipitation (n = 3 blots for each condition). (C) Effects of TRPC1 mutants on the gD-TRPC1 interaction. Five mutations were introduced on the three ectodomains of TRPC1 as shown in the cartoon. Middle and right panels show representative images and statistics for gD-TRPC1 interactions measured by FRET in HEp-2 cells transfected with vectors overexpressing mutant TRPC1 (S1 to S5). (D) Effect of TRPC1 mutants on HSV-1 entry. HEp-2 cells were transfected with mutant TRPC1 (S1 to S5) vectors, and viral entry was analyzed with β-Gal assays. Scale bars, 10 μm. **P < 0.01 and ***P < 0.001 by one-way ANOVA (A and C) or two-way ANOVA (D). Graphs show the mean ± SD.
