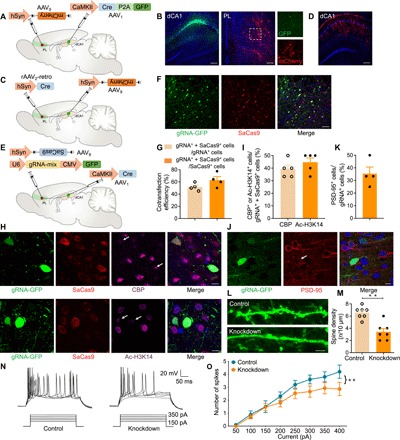
Fig. 2. Perturbing cbp in postsynaptic PL neurons receiving dCA1 inputs.

(A) A schematic of the experiment: AAV1-CaMKII-Cre-P2A-GFP injection in bilateral dCA1 and AAV9-hSyn-DIO-mCherry injection in bilateral PL. (B) Coronal sections showing dCA1 labeled with GFP and PL labeled with Cre-dependent mCherry and dCA1 axons expressing GFP. Scale bars, 200 μm. (C) A schematic of the experiment: rAAV2-retro-hSyn-Cre injection in bilateral PL and AAV9-hSyn-DIO-mCherry injection in bilateral dCA1. (D) Coronal sections showing dCA1 labeled with Cre-dependent mCherry. Scale bar, 200 μm. (E) A schematic of the experiment: AAV1-CaMKII-Cre was injected bilaterally into the dCA1, and a mixture (1:1 ratio) of AAV9-hSyn-DIO-SaCas9 and AAV9-U6-gRNA-mix-CMV-GFP was injected into bilateral PL. (F) Expression of SaCas9 and gRNA-GFP in the PL 4 weeks after AAV delivery. Scale bar, 50 μm. (G) Cotransfection efficiency of gRNA and SaCas9 (n = 4 slices from three animals). (H) Immunofluorescence staining of CBP (top) and Ac-H3K14 (bottom) in the PL 4 weeks after AAV injection. The white arrows indicate decreased CBP expression and H3K14 acetylation in SaCas9- and gRNA-GFP+ neurons. Scale bars, 10 μm. (I) Quantification of CBP- or Ac-H3K14+ cells in the targeted neuronal population (gRNA+ + SaCas9+) (n = 5 slices from three animals). (J) Immunofluorescence staining of PSD-95 in the PL 4 weeks after AAV injection, with the white arrow indicating decreased PSD-95 expression in gRNA-GFP+ neurons. Scale bar, 10 μm. (K) Quantification of PSD-95+ cells in the targeted neuronal population (gRNA+) (n = 4 slices from three animals). (L) Decreased dendritic spines in PL neurons after cbp knockdown by SaCas9 and gRNA-mix. Control neurons were transfected with the same AAV with gRNA-mix replaced with gRNA-control. Scale bar, 5 μm. (M) Spine density quantification (t test, t12 = 4.88, **P < 0.01; n = 3 animals per group, two to three slices per animal). (N) An example of AP responses to positive current steps recorded from PL neurons of control and cbp knockdown groups. (O) Number of APs induced by injected currents in PL neurons from control and cbp knockdown rats [n = 10 and 15 neurons; **P < 0.01, two-way analysis of variance (ANOVA)]. Group effect: F1,72 = 11.38, P < 0.01; current intensity effect: F7,112 = 18.95, P < 0.01; interaction: F7,72 = 0.84, P > 0.05.
