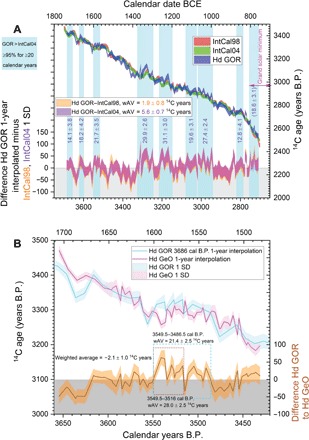
Fig. 2. Comparisons of the 1- or 0.5-year linear interpolated Hd GOR dataset with other NH calibration datasets.

(A) Comparison of the Hd GOR dataset placed as in Fig. 1B (3686 cal B.P., 1737 BCE) versus the IntCal98 (1) and IntCal04 (2) calibration curves. Differences (weighted averages) in 14C years are indicated overall and for nine periods where larger positive offsets are apparent for ≥95% of ≥20 consecutive years. (B) Comparison of the Hd GOR and Hd GeO time series. The overall difference is shown, and the larger positive offsets apparent 3549.5 to 3516 cal B.P. and 3549.5 to 3486.5 cal B.P. are indicated. All error bands shown are 1 SD.
