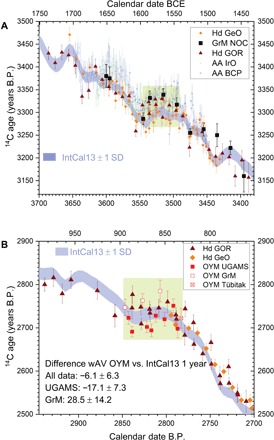
Fig. 3. Comparison of the NOC and OYM data versus Hd GeO, Hd GOR, IntCal13 (1 SD band), and AA BCP and AA IrO (13).

(A) GrM data (weighted averages) on the NOC oak samples (table S1) as best placed (μ ± σ) via a wiggle match (39) versus Hd GOR (Fig. 2A). (B) The GrM, UGAMS, and Tübitak data on the OYM pine sample (table S1) shown as best placed (μ ± σ) versus IntCal13 (4). The shaded areas indicate (A) the earlier 16th century BCE offset in the NOC and Hd GOR data and (B) the mixed GrM and UGAMS signal for OYM versus IntCal13.
