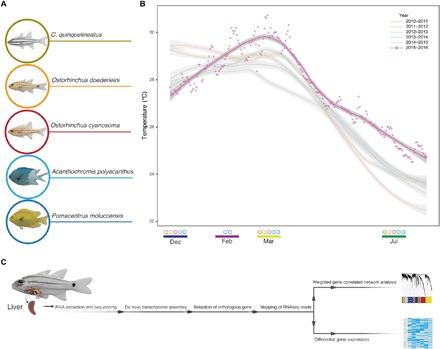
Fig. 1. Summary of the sampling design.

(A) Five fish species analyzed in this study. (B) Temperature records for the sampling location from 2010 to 2016. Dots are daily averages in 2015–2016. The trendlines representing the 5 years before the heatwave, as well as 2015–2016, are based on the t-based approximation of the daily temperature averages. The circles at the bottom represent the species collected in that month (i.e., only A. polyacanthus and P. moluccensis were collected in February). Average temperatures for each month were as follows: December, 27.81°C (SD ±0.45°C); February, 29.55°C (SD ±0.69°C); March, 29.70°C (SD ±0.61°C); July, 24.96°C (SD ±0.28°C). (C) Schematic representation of the sample processing from liver extraction to gene expression analysis. RNASeq, RNA sequencing.
